Rob DeLeo
This section of Discover Society is provided in collaboration with the journal, Policy and Politics. It is curated by Sarah Brown.
From the number of drug overdoses to annual average temperatures, public transportation passenger data to Gross Domestic Product (GDP), government is inundated with data documenting social problems. In theory, government statistics, which are commonly referred to as “indicators” by social scientists, should lead to more informed decision making. Numbers are assumed to be far more objective than other problem measures, like stories and other anecdotes, which often rely on more subjective interpretations of a social issue. We accept numbers at face value, a testament to the widely held belief that data is far less vulnerable to wanton political manipulation.
In practice, however, numbers are heavily politicized. Even a passive observer of the political process can likely recall a statistic that they found misleading or even patently false. Others question the accuracy of the methodologies used to generate these statistics. Indeed, as famed policy scholar Deborah Stone observed, the choice of what to count and how we count it is ultimately a political decision.
The selection and interpretation of indicators is highly contentious. Organized interests fight to ensure government accept their preferred measure of a given problem. The outcome of these debates is hardly trivial: virtually every major theory of policy making suggests indicators can play an important role in provoking policy maker action. Perhaps most importantly, changes in indicators, which are often assumed to represent deviations from the status quo, can help bring issues to the attention of policy makers, the media and the general public.
The Multiple Streams Framework (MSF)
Consider, the Multiple Streams Framework (MSF), which is one of the most prolific theories of agenda setting, having been cited in more nearly 2, 000 peer-reviewed articles since 2000 according to a 2016 meta-analysis by Jones et al. MSF argues that agenda setting, which describes the process through which issues are selected for consideration by a decision-making body, is facilitated by the coupling of three distinct streams: (1) the problem stream, which consists of the various social issues competing for policy maker attention; (2) the policy stream, which encompasses the various policies and programs designed to address items in the problem stream; and (3) the politics stream, which broadly describes the current political environment, including trends in public opinion as well as the composition of government. Coupling is aided by a policy entrepreneur or an individual or organization willing to invest a considerable amount of time and energy to secure policy change. Once the three streams are coupled, a policy window is opened providing organized interests with an opportunity to push their pet issues onto the policy agenda and, ideally, secure policy change.
According to MSF, indicators represent one of the various elements comprising the problem stream. The MSF describes indicators as “more or less objective” measures of a problem. Like other theories, it underscores the fact that policy makers are drawn to changes in indicators, although its founder, John Kingdon, suggests “data do not speak for themselves.” Indicators, in other words, require interpretation and definition before they can help trigger agenda setting.
Despite their obvious importance to the agenda setting process, indicators have received relatively little explicit attention by scholars applying the MSF. To be sure, scholars frequently reference the concept. Indeed, nearly 69 percent of the studies included in the 2016 review by Jones et al made at least one reference to the term. Yet closer analysis reveals that the overwhelmingly majority of these references were made in passing. Scholars, it seems, have been content to note that a “change in cases” elevated policy maker concern without actually addressing how, why, and under what conditions indicators influence the agenda setting process. Moreover, most of these studies fall short of quantitatively analyzing the relationship between indicators and agenda setting, a curious omission given that competing theories have devised complex models capturing the relationship between better information and policy change.
My recent Policy & Politics article begins to fill this void. It specifically examines pandemic influenza (avian and swine influenza) and Ebola policy making in the United States. Emerging disease cases are readily tracked and tabulated, making these domains an ideal setting for investigating indicators and agenda setting.
When and under what conditions do indicators trigger agenda setting and policy change in emerging disease domains? My work suggests two patterns:
Rapid Indicator Accumulation
In this instance, indicators amass quickly and in large quantities, often over a period of months, if not weeks. The 2014 Ebola epidemic, for example, was more than 15-times greater than all previous outbreaks combined. Similarly, the 2009 swine influenza pandemic was hundreds of times larger than the various avian influenza outbreaks of the early 2000s. Rapid indicator accumulation almost always results in issue attention and, at least with respect to emerging diseases, signifies the dawn of a large-scale crisis. Rapid accumulation events speed their way onto the policy agenda.
However, rapid accumulation is not necessarily a recipe for policy change. In the pandemic influenza and Ebola cases, rapid indicator accumulation did not provide sufficient time for policy entrepreneurs to mobilize and the streams to converge. While government officials certainly expressed concern with how these crises were being managed, they did not devise many new laws or programs during this period, at least not at the national level.
Gradual Indicator Accumulation
This pattern, which is much more commonplace in emerging disease domains, sees indicators amass slowly and in much smaller quantities over a period of months, if not years. For example, small outbreaks of avian influenza plagued Southeast Asia from 2004 to 2007, although the virus never mutated into a pandemic strain capable of triggering a large-scale global crisis.
Gradual indicator accumulation is forward looking and suggests the possibility of looming—and much larger—events. In many instances, policy makers ignore gradually accumulating indicators. Congress largely disregarded the various Ebola outbreaks of the 1990s. In fact, save a brief flicker of concern about the possibility of a weaponized Ebola virus, policy makers paid very little attention to the virus prior to the 2014 Ebola epidemic.
However, in those instances when gradually accumulation indicators do catch the eye of policy makers, the likelihood of substantive policy change is much greater than in the instance of rapid indicator accumulation. This is best evidenced in the avian influenza example. The gradual accumulation of avian influenza cases slowly stoked fears about the possibility of a larger pandemic event emerging. Gradually accumulation allowed for the development of policy solutions, the emergence of policy entrepreneurs, and the cobbling together of political coalitions. Policy makers eventually passed a number of important preparedness laws during this period, including the Pandemic and All-Hazards Preparedness Act (PAHPA), which authorizes the Secretary of the Department of Health and Human Services (DHHS) to oversee the federal government’s response to public health emergencies, and the Public Readiness and Emergency Preparedness Act (PREPA), which shields vaccine manufacturers from tort liability for damages arising from drugs developed to fight a pandemic strain of influenza.
Does Data Matter?
Distinguishing between rapid and gradual indicator accumulation lends a degree of nuance to MSF’s understanding of the dynamics of issue attention in response to indicator change. However, much work remains. Most notably, public health is not necessarily representative of all policy domains. Public health has a longstanding tradition emphasizing data-driven decision making, which means the accuracy of many important indicators, like disease cases and deaths, is rarely contested or challenged.
The same cannot be said of many other areas of policy making. Policy makers frequently haggle over the best measures of economic health. Similarly, measures of global warming, like annual average temperatures, are readily scrutinized by conservative and industry groups hoping to undermine calls to mitigate climate change. It is imperative that we gain a deeper understanding of the extent to which these heavily politicized indicators can influence the agenda setting process.
Information and indicators matter, but only sometimes. Whether or not the outbreak of a new disease triggers a government response is ultimately determined by a host of contextual and political factors that transcend the “objective” value of statistics. Numbers can provide an important impetus for policy making but if—and only if—organized interests are ready and willing to mobilize and fight for—or against—policy change.
Rob DeLeo is Assistant Professor of Public Policy in the Department of Global Studies, Bentley University, Waltham, Massachusetts. If you enjoyed this article, you may be interested to read Evidence translation: an exploration of policy makers’ use of evidence.
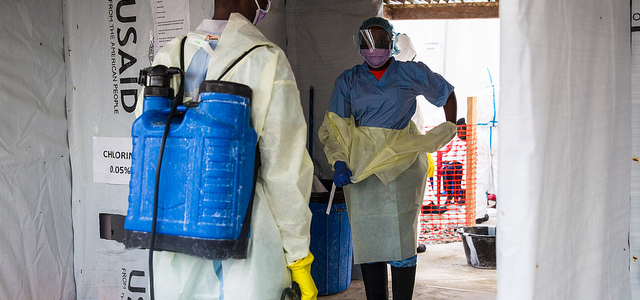
Image: Siah Tamba, Ebola survivor and Ebola hero who now works at the Ebola treatment unit (ETU) in Sinje, Grand Cape Mount, Liberia, after losing her mother, sister, and daughter.
The facility is operated by the International Organization for Migration (IOM) in partnership with Liberia’s Ministry of Health and Social Welfare (MOHSW) and supported by USAID’s Office of U.S Foreign Disaster Assistance.
Sinje, Grand Cape Mount, Liberia, on 28 January 2015
Photo: UNMEER/Martine Perret
Reproduced under the Creative Commons Attribution No Derivatives 2.0 legal code