
Mary Brown and Stephen McKay
The Integrated Communities Strategy Green Paper talks a lot about classes – particularly language classes – but does not discuss class, as social class.[1] Problems among the White community are described as relating to White British disadvantaged pupils (our emphasis), but even these are somewhat glossed over, whilst the picture on employment needs further refinement as it reflects historic class-based differentials. In this response we draw on available literature and data, and the ongoing ethnographic research of one of us (Brown) to scrutinise the education and employment analysis used in the Green Paper.
Education
The Green Paper (p. 26) states that, “overall gaps in educational achievement by ethnic group have narrowed considerably over the last 20 years”, but its indirect evidence for this finding[2] opens with a concern about the educational outcomes of White working class pupils, whilst the primary source emphasises that for pupils entitled to FSMs that all ethnic minority pupils outperform White British pupils, a gap that may be widening.[3] Kirby and Cullinane (2016) discuss a possible contribution from “cultural and curricular norms” which Brown’s ongoing research confirms as a lower aspiration among rural White children to attend university.
Graduate qualifications are particularly associated with doing well in the labour market (ONS 2017) so it may also be significant that the proportions with degree-level qualifications are higher among ethnic minority groups than for the White population (see Table 1). If we look at younger people there is a clear social class gradient for obtaining a degree, with about twice as many graduates from a professional class background as from those with intermediate or routine jobs, with a ratio greater than 2:1 for the White group. This class gradient was also present for the other (non-White) ethnic groups, but shallower.
Table 1: Proportion of 25 year-olds with degrees by social class of family at age 13/14.
| Family class background | White | Black | Mixed | Indian | Pakistani, Bangladeshi | Any other | Total |
| Prof / mgnr | 38% | 41% | 39% | 67% | 55% | 68% | 40% |
| Intermediate, routine | 17% | 39% | 26% | 43% | 34% | 39% | 20% |
| Others | 21% | 41% | 18% | 46% | 21% | 28% | 24% |
| Total degree | 25% | 40% | 29% | 49% | 30% | 48% | 27% |
Source: own analysis of ‘Next Step’ waves 1 and 8, previously known as the Youth Cohort Survey or the Longitudinal Study of Young People in England (LSYPE).[4]
Moreover, “between 2007/08 and 2015/16, the number and percentage of undergraduate entrants decreased for the White ethnic group, but increased for all other ethnic groups”.[5] The social mobility ‘coldspots’ identified by the Social Mobility Commission (2017), particularly ‘remote rural or coastal areas’, have below-average proportions of minority ethnic groups.
Labour market outcomes
If the White population is falling behind on educational qualifications, why do they continue to enjoy an advantage in the labour market? There are three main reasons. First, the advantage in employment rates is associated with poorer earnings progression and slightly lower occupational status. Second, the employment advantage is mostly sustained by a higher social class family background which, it seems likely, will not be sustained for future generations. Third, ethnic minority groups face discrimination in the labour market (e.g. Ashe, 2018). Differences in social capital or in ‘softer’ (non-academic) skills could also play a role.
We confirm a sizeable ethnic employment penalty. As Figure 1 shows, for younger men and women the White population are the most likely to be in paid employment (ages 16-29 shown, although the pattern holds throughout the age range).
Figure 1: The White population is the most likely to be in paid work aged 16-29
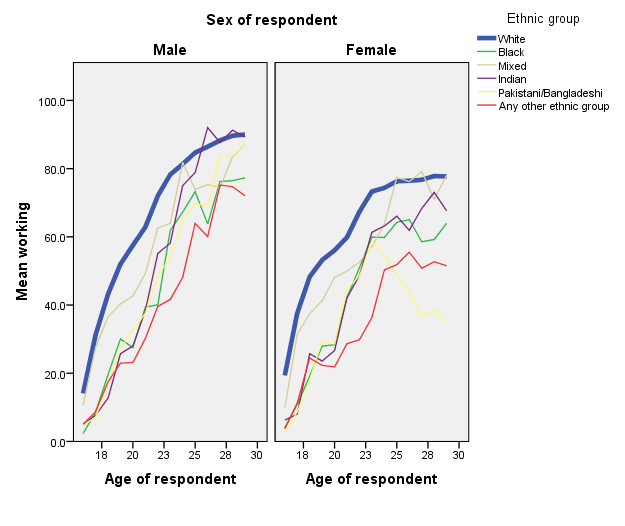
Source: own analysis of Annual Population Surveys for 2013, 2014, 2015, 2016 and 2017.
However, the rate of employment is only one measure of labour market success. Analysis of the Annual Population Surveys also shows that White employees were among the least likely to be working in professional/managerial occupations (NSSEC group 1/7), and the most likely to be working in the ‘routine’ occupations (NSSEC group 7/7), for both men and women. Moreover, as shown in Figure 2, the White population’s earnings (median hourly pay) are typical for men, at best, whilst for women the hourly earnings of the White population tend to be lower than for those in other ethnic groups.
Figure 2: The earnings of the White population are barely average (aged 16-29) or below average (for women)
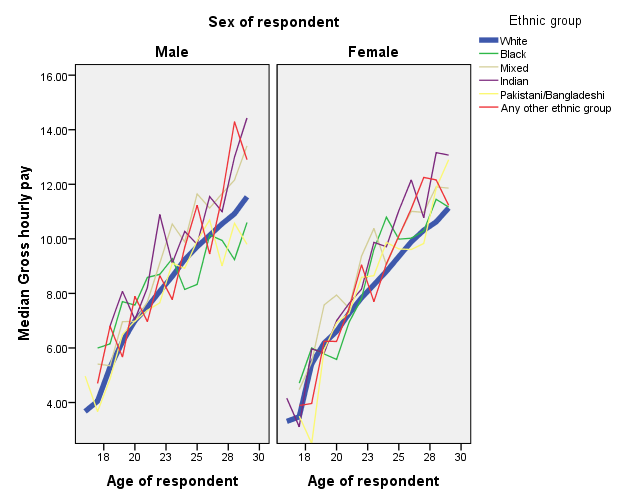
Source: own analysis of Annual Population Surveys for 2013, 2014, 2015, 2016 and 2017. Base: full-time in main job.
The employment advantage is associated with the higher class background of White young people. After controlling for that – see Table 2 – there is little White advantage for those from professional backgrounds. For those aged 25, over one-third (34%) of the White group had a managerial or professional family background, compared with only 10% of the Pakistani/Bangladeshi group and 22% for those identifying as being of Indian ethnic group. But, as noted above, there is not the same class advantage for younger workers.
Table 2: Proportion of 25 year-olds in paid work by social class of family at age 13/14.
| Family class background | White | Black | Mixed | Indian | Pakistani, Bangladeshi | Any other | Total |
| Prof / mgnr | 85% | 89% | 86% | 80% | 79% | 70% | 85% |
| Intermediate, routine | 77% | 69% | 68% | 83% | 78% | 62% | 76% |
| Others | 74% | 63% | 67% | 78% | 70% | 74% | 73% |
| Total in paid work | 79% | 73% | 74% | 81% | 75% | 67% | 79% |
Source: own analysis of ‘Next Step’ waves 1 and 8.
Last, the White population were the least likely to have found their jobs using either Agencies or education-based advice, and among the most likely to have gained their job using personal contacts (analysis of Next Steps wave 8). This indicates a role for social capital, or perhaps non-academic skills.
It also seems that the White population are experiencing some ‘subjective’ concerns as a potential result of lower social mobility. As shown in Figure 3, the younger White population were the least likely to agree that ‘Britain is a place where hard work is rewarded’ or that it is easier for them to improve things than their parents’ generation.
Figure 3: Attitudes of 25 year-olds by ethnic group.
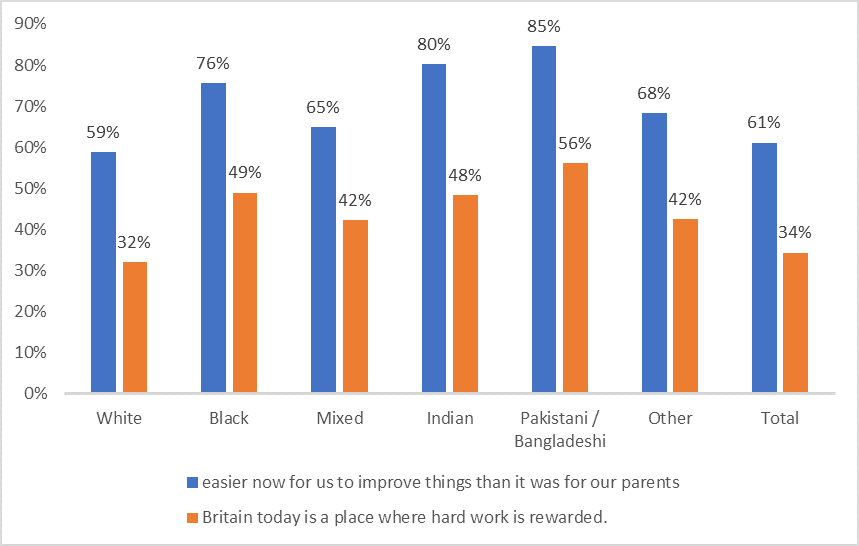
Source: ‘Next Steps’ wave 8.
Sociologists have long been interested in the transition of young people into the labour market, males especially.[6] Social and cultural transformations since earlier ground-breaking research have presented challenges to modern schooling and have been accompanied by de-industrialisation and the fragmentation of traditional lifestyles. Competition and pressure are elements that may deter working class boys from conforming to school requirements, and reflect socioeconomic changes away from a traditional working class counter school culture. Ongoing research (Brown) suggests that many lower-achieving students have a work-based focus, with perhaps an ‘instant gratification’ attitude to working and bringing in money at a younger age (for instance around cars, particularly in rural areas). The majority of AS level student participants in MB’s current study noted a strong sense of competition in both driving or causing them to reject expectation in education.
The Green Paper has laudable aims in attempting to bring communities together. However, it tends to downplay the strong and impressive progress already made towards gaining academic qualifications, apart from among the White population (and particularly for those from a working class background).
There remains an overall ethnic minority penalty in the labour market, contra to the educational progress and this relates to employment rates though not to the quality of work. Part of success in employment is also related to interaction with families and peers which may well be shaped by cultural differences. This may contribute to the ethnic minority ‘penalty’. Working class culture may be more conducive to conforming to the labour market than to the educational system, but overall success in rates of employment should not stop further investigation of the occupational profiles of those jobs and the opportunities for progression, nor the exclusion of some groups through discrimination (see Ashe, this volume).
Notes
[1] A case study on page 29 slips though in allowing a now-merged school to be described as having pupils from a “White British working class background.”
[2] Stokes, L.; Rolfe, H.; Hudson-Sharp, N.; Stevens, S. (2015). A compendium of evidence on ethnic minority resilience to the effects of deprivation on attainment. National Institute of Economic and Social Research & University of Oxford 015. ISBN: 978-1-78105-482-6.
[3] Strand, S. (2015) Ethnicity, deprivation and educational achievement at age 16 in England: Trends over time. Report to the Department for Education.
[4] Data from ‘Next Steps’ was supplied by the UK Data Service. University College London. UCL Institute of Education. Centre for Longitudinal Studies. (2018). Next Steps: Sweeps 1-8, 2004-2016. [data collection]. 14th Edition. UK Data Service. SN: 5545. We thank these groups, and the respondents providing data, but only we are responsible for the interpretations made here.[5] See Government statistics website on ethnic minorities.
[6] Perhaps most famously, Willis, P. (2017). Learning to labour: How working class kids get working class jobs. Routledge.
Mary Brown is an associate lecturer and Stephen McKay a professor, within the School of Social & Political Sciences at the University of Lincoln.
Image: Made by apprentices reception: Restaurant Associates. CC BY-NC-SA 2.0