Mark Shephard and Stephen Quinlan, University of Strathclyde
In 2012, 33 million British people accessed the Internet every day, more than double the number who did so in 2006 (Office of National Statistics UK, 2013). Part of this growth is a consequence of the rise in popularity of social media – today channels such as Facebook and Twitter are now a regular part of most people’s daily lives. Almost half of UK adults (48%) use social networking sites regularly, while 53% of Britons use the internet purely for social media alone, meaning the UK has the second highest proportion of social networkers in the EU, second only to the Netherlands (Office of National Statistics UK, 2013).
It comes as no surprise therefore that social media is taking on a greater importance in politics as it provides a means of engaging actively with the media and of interacting with the public and campaign supporters, as well as a means to influence the political agenda. Since the Barack Obama campaign of 2008, political campaigns are now expected to employ both offline and online strategies. Consequently, understanding online campaign activities is important to get a complete flavour of campaigns.
So what is the current state of play in the online world with respect to the Scottish independence referendum campaign? We have been tracking the Facebook and Twitter account activity of the two main campaigns: Yes Scotland (YS) and Better Together (BT) to explore the level of interactivity between social media users and the campaigns. In this contribution, we detail the current status of both campaigns’ online presence. We show that there has been greater activity and enthusiasm on the ‘yes’ side compared to the ‘no side’. Furthermore, our analysis suggests that the YS campaign has solidified its lead over the BT campaign in terms of activity and interest on social media over the past eight months. But with Scots not going to the polls until September 2014, the challenge for the ‘yes’ side leading up to the vote will be to translate the evident advantage in enthusiasm and support for their cause online into a campaign that succeeds in persuading others to cast a ‘yes’ vote at the ballot box.
Data
Our analysis is based on tracking the Facebook and Twitter accounts of ‘Yes Scotland’ (YS) and ‘Better Together’ (BT) each weekday since August 2013 on a range of indicators including the number of likes for a Facebook page, the number of twitter followers, and the number of tweets from each campaign. We distinguish two different types of interactions on these mediums: visitor-driven and campaign-driven.
Visitor driven activity comes in the form of people visiting and actively interacting with a campaign’s page/account – by perhaps ‘liking’ a page or talking about a page in terms of Facebook, or following an account on Twitter. Campaign driven activity is activity by campaigns themselves and would take the form of number of posts put up on a FB wall, or the number of tweets the campaign sends out.
Visitor-driven activity
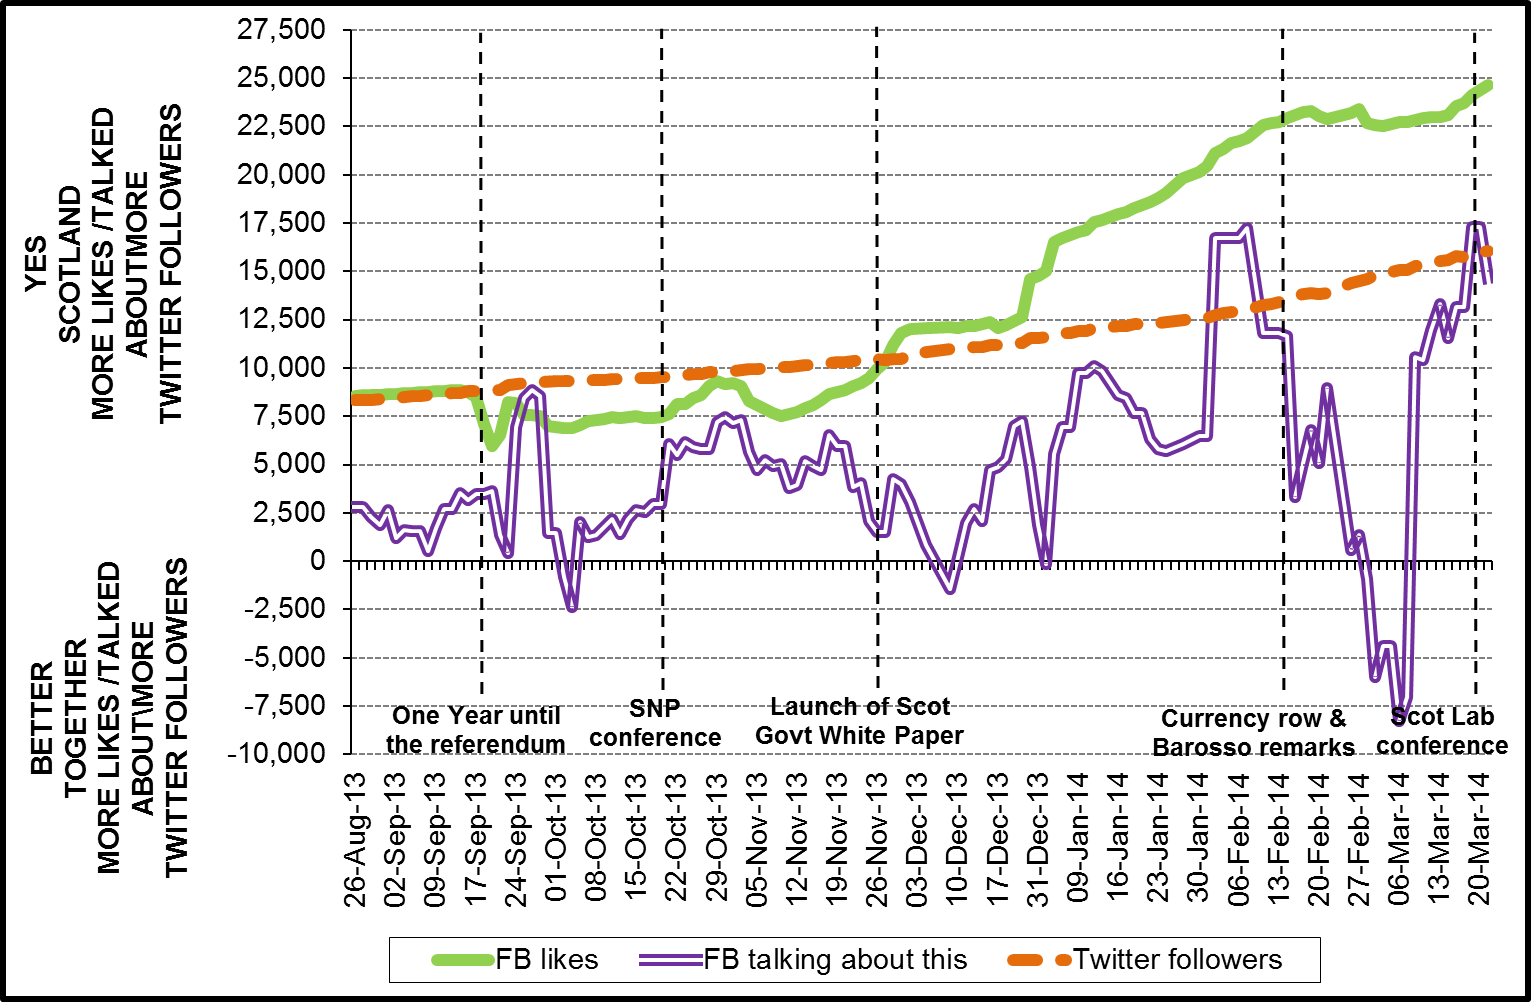
Figure 1 compares the differences between the two campaigns on three visitor driven indicators. First, the green continuous line tracks the difference in the number of ‘likes’ each campaign’s official Facebook page has received. It is calculated by subtracting the ‘likes’ for the ‘Better Together’ campaign’s page from the ‘likes’ for the ‘Yes Scotland’ page (the direction of the scoring is purely arbitrary). Second, the purple line represents a measure of the extent to which the two Facebook pages have been ‘talked about’ on average during the previous seven days. This metric is based on the extent of engagement with a campaign’s page such as the average number of likes a page receives, the number of posts to a page wall, the level of ‘liking’/commenting/sharing of a wall post, and the number of
Figure 1 Difference between ‘Yes Scotland’ (YS) and ‘Better Together’ (BT) campaigns in social media visitor driven activity – August 2013 to 21 March 2014.
In each case, a positive score indicates that the YS campaign scored more highly and a negative score that the BT campaign scored more highly. Thirdly, the orange dashed line in Figure 1 shows the difference between the number of people ‘following’ the YS Twitter account and those following the BT one.
‘Likes’ for a Facebook page can be interpreted as a measure of interest and/or support for a campaign and, given that it requires minimal effort (just a click of a button), is the easiest way for an individual to engage with the campaign of either side. Our data show that the YS campaign has consistently received more ‘likes’ than the BT campaign. Furthermore, since the launch of the independence White Paper on 26 November 2013 the gap in ‘likes’ between them has increased. On average, before the White Paper was launched, the YS Facebook page had been ‘liked’ on around 8,000 more occasions than the BT campaign. Since the launch of the White Paper, that average gap has grown to nearly 19,000. At the time of writing, the YS Facebook page had been liked on no less than 25,000 more times than its BT counterpart.
The Facebook ‘talked about’ metric (represented by the purple line) is a more informative indicator of how much citizens are engaging with the two campaigns. ‘Talking about’ a campaign, by, for example, commenting/sharing a wall post, or tagging a photo, requires a greater level of effort on the part of the user than simply ‘liking’ a page. On this measure, interaction with each of the campaigns tends to ebb and flow, partly because the metric represents a seven day average but also it appears in response to key campaign events. Our data suggests that spikes in the number of people ‘talking about’ both campaigns occur when specific events or flare ups in the campaign happen – for example: at the time the White Paper was launched in November 2013 and during the currency row and discussions over Scotland’s membership of the EU in February 2014, the numbers of people talking about both campaigns increased substantially compared to their mean scores over the prior eight months.
For the most part, Figure 1 shows that the YS campaign has consistently been the more ‘talked about’ campaign thus far. The exception to this coincided with the currency row and the comments from EU Commission President Manuel Barrosso in February 2014 regarding Scotland’s membership of the EU. Here the BT campaign appeared to get more traction in terms of being more ‘talked about’ on Facebook. That being said, of the 134 data time point observations we have collected by the time of writing, the BT campaign was the more talked about on only eight occasions (approximately 6%). Overall then, the YS campaign has tended to gain more traction in terms of being ‘talked about’ on Facebook.
Turning to twitter, the orange dotted line in Figure 1 illustrates the difference in the number of Twitter followers each campaign has attracted up to March 2014. It shows that the YS campaign has been engaging more people than the BT campaign, with this gap steadily widening as the campaign has heated up. In August 2013, the gap between the campaigns was approximately 8,000 followers. At the time of writing the YS campaign had accumulated about 16,000 more Twitter followers than the BT campaign. However, it does not appear that this gap is influenced to the same extent by campaign events as the Facebook ‘talked about’ metric, with the increase in twitter followers for the YS campaign relatively linear. In sum, in terms of visitor activity, the YS campaign to date has had the edge.
Campaign driven activity
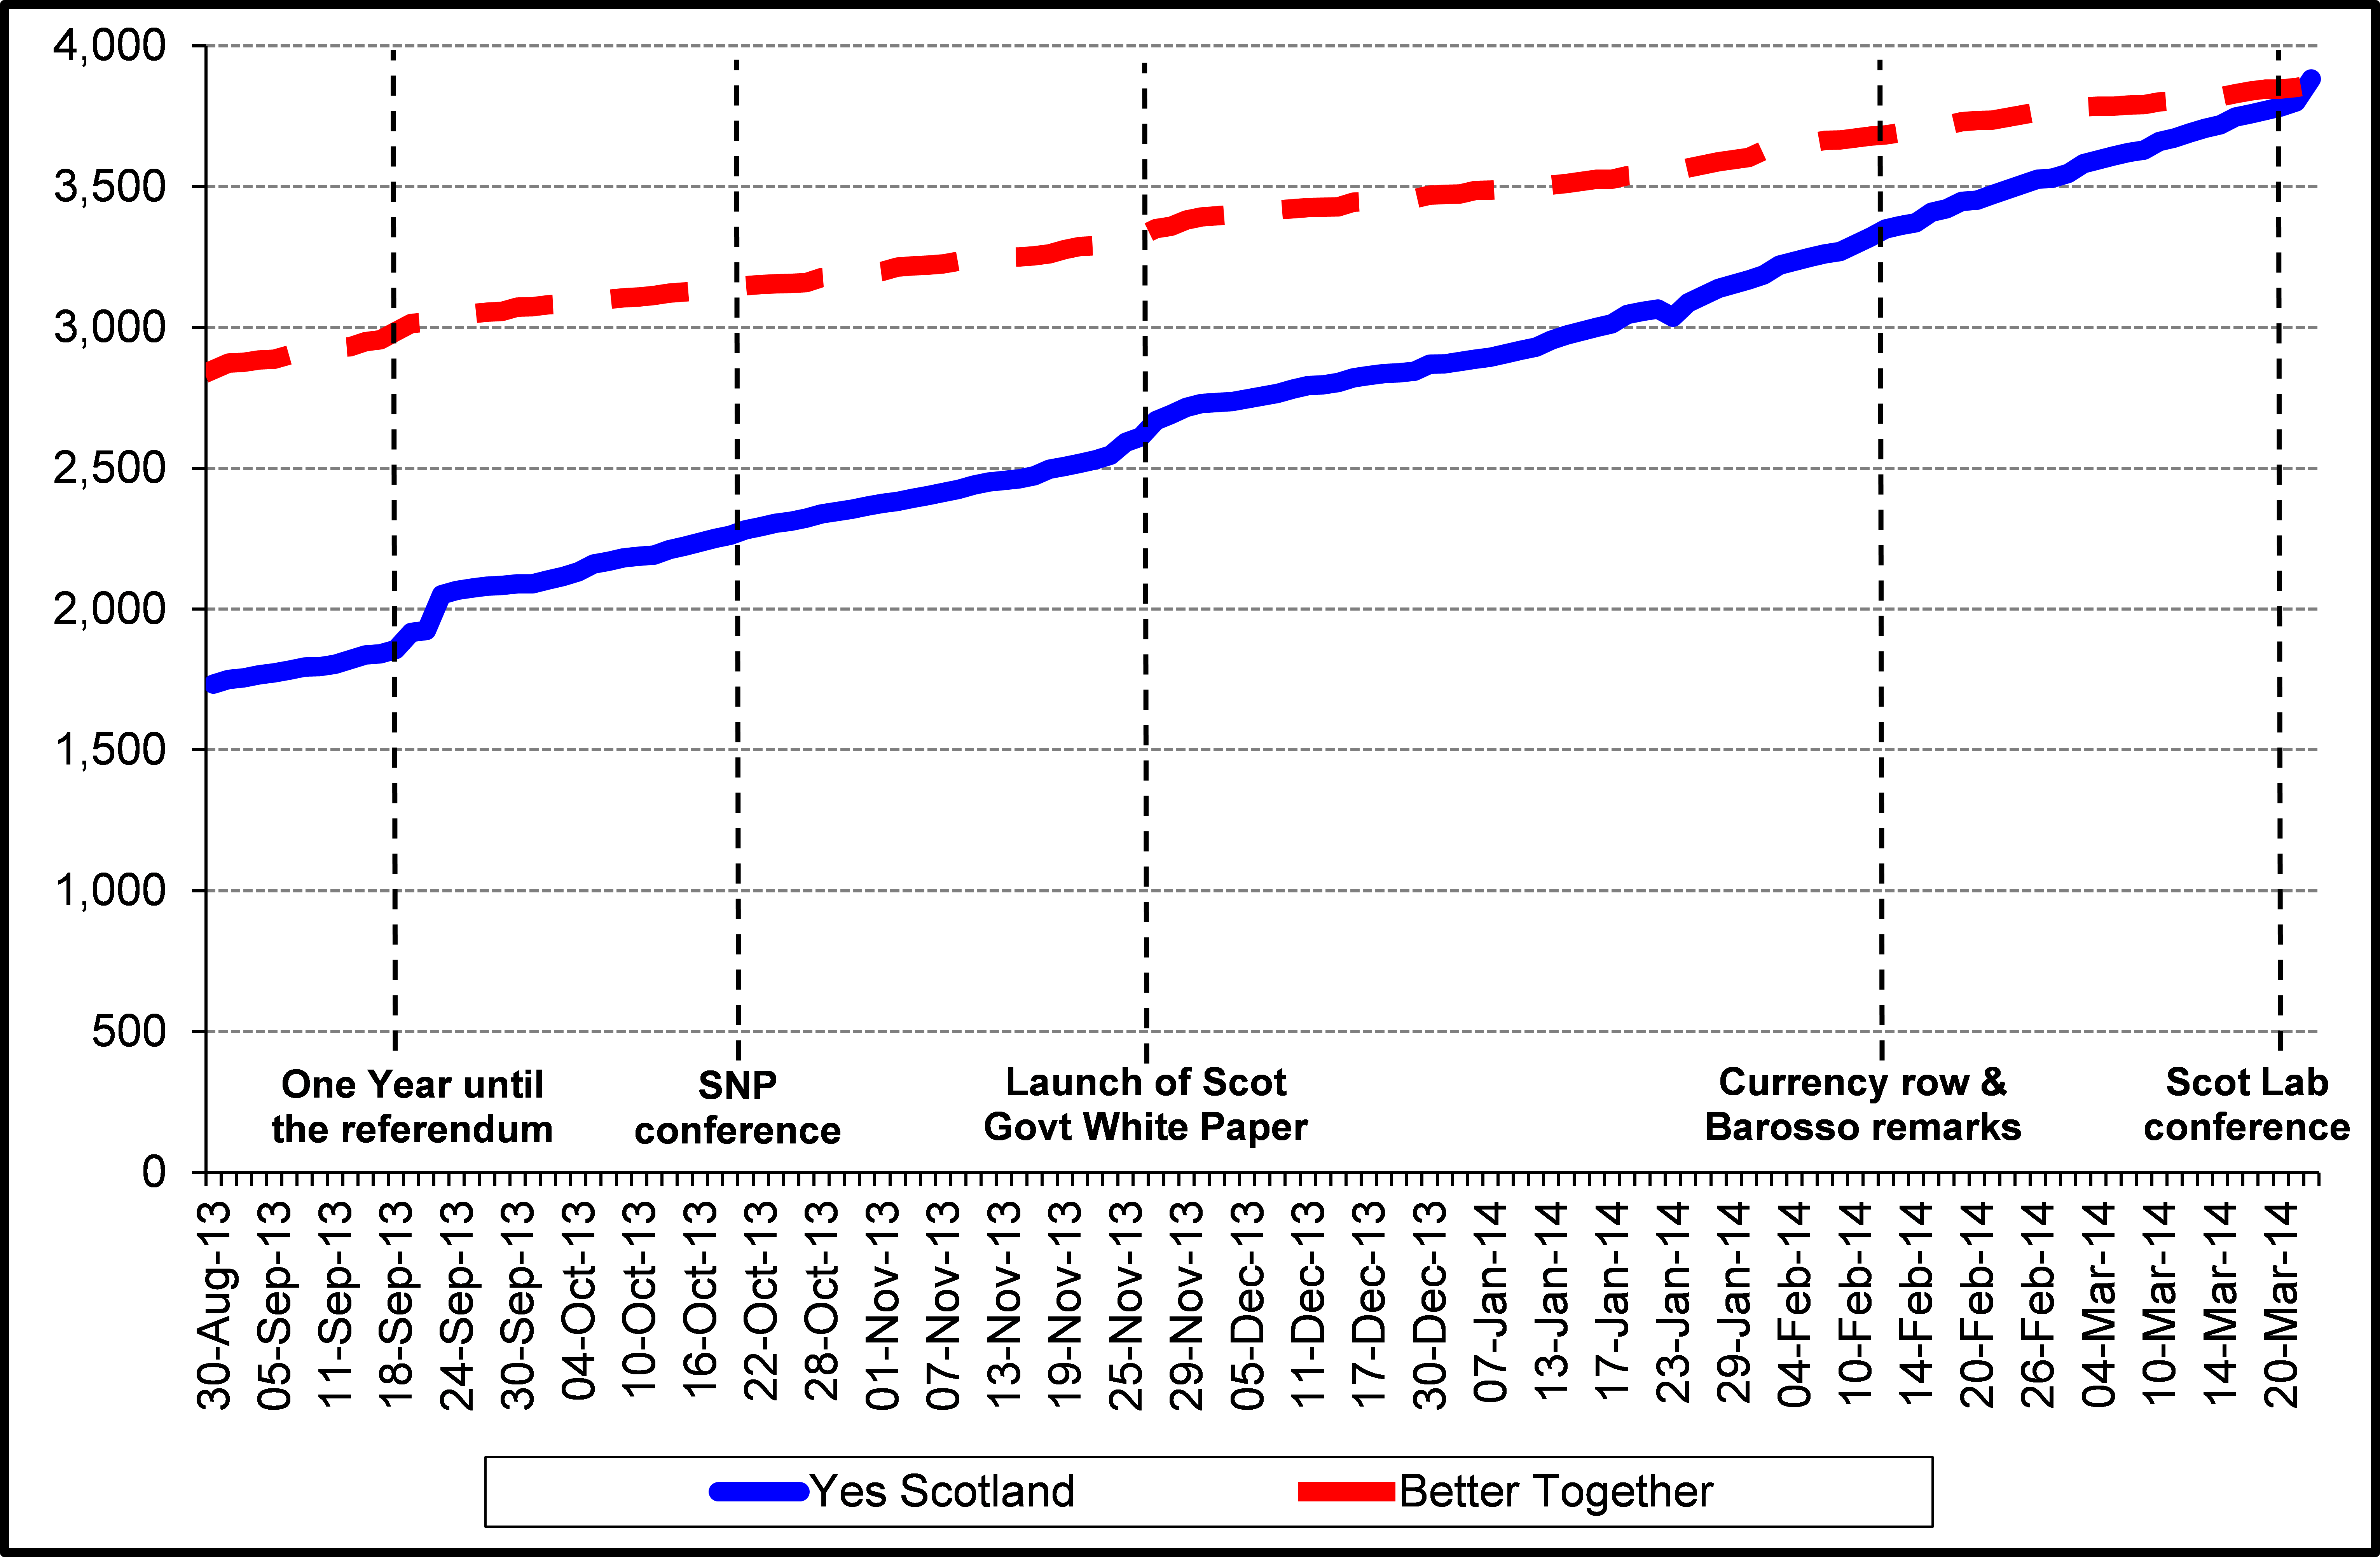
Figure 2 illustrates the number of tweets originating from each of the two campaign’s twitter accounts since August 2013. As we can see, initially the Better Together campaign had a solid lead over the YS campaign in terms of tweeting. However, the difference in the number of tweets has been steadily eroding over time. The YS campaign has been particularly active in tweeting since the launch of the independence White Paper in November 2013 and has just overtaken the BT campaign for the first time in terms of tweets in March 2014. In sum, the YS campaign also now appears to have a lead in terms of campaign driven activity in social media too.
Figure 2 Number of tweets from ‘Yes Scotland’ (YS) and ‘Better Together’ (BT) campaigns: social media campaign driven activity – August 2013 to March 2014.
Social media campaigning: necessary but no guarantees
It is clear that, at least so far as the official campaigns are concerned, the Yes side to date has been coming out on top in terms of generating enthusiasm online be it among visitors or in terms of the campaign itself selling their message to the online community. Thus, the enthusiasm of some ‘yes’ supporters for letting their views be known via social media, which has become legendary, is not without foundation.
However, while recent opinion polls do suggest a narrowing in the gap between the ‘yes’ and the ‘no’ side, the ‘no’ side has maintained a consistent lead among the general public. This begs the question as to why, so far at least, the online enthusiasm for the ‘yes’ side has not translated into a lead for the ‘yes’ side in the opinion polls? In part the answer may lie in the fact that younger people are more likely to use Facebook and are also rather more likely to be in favour of independence (Curtice 2013). But more importantly, we can expect that visitors to a campaign’s Facebook pages and followers of their Twitter accounts are likely to be sympathetic to that campaign’s cause in the first place. The social media world is more one where the committed interact with each other rather than one where converts are made.
Waging a campaign online and maintaining a sufficient online presence is a necessary and important part of modern day campaigning. But wining the online enthusiasm battle is not enough and certainly provides no guarantee of victory. The challenge for the ‘yes’ side in the run up to the referendum is to overcome the tripping point and to translate its evident advantage in communicating its message in the virtual world of social media into greater support on the streets and doorsteps of Scotland.
Mark Shephard is Senior Lecturer at the School of Government and Public Policy, University of Strathclyde. Stephen Quinlan is a post-doctoral research fellow at the University of Strathclyde working on the ESRC/AQMeN Future of the United Kingdom and Scotland research project focusing on the impact of social media on the Scottish independence referendum and funded by the UK Economic and Social Research Council (ESRC) in conjunction with the Advanced Quantitative Methods Network (AQMeN) as part of the ‘Future of the UK and Scotland’ research programme see: www.esrc.ac.uk/major-investments/future-of-uk-and-scotland.


