John Curtice, Stephen Fisher, Jouni Kuha and Jonathan Mellon
Social scientists aim to understand and explain human behaviour. If they are successful in identifying what systematically influences human behaviour, then presumably they should not only be able to illuminate the past but also predict the future. Indeed, forecasting what is going to happen to the economy is a challenge with which economists are regularly faced.
‘What will be the result of the next election?’ is the challenge with which political scientists are most commonly faced. Numerous models of election forecasting have been developed. Most are built on the assumption that in some way or other past patterns will be repeated. If, for example, governments generally appear to be popular when the economy is doing well and not so popular when an economic downturn occurs, this relationship can be modelled to predict the outcome of an election some weeks or months hence.
Many of these attempts at forecasting elections rely to some extent at least on opinion polls. But, as has been evident at recent UK general elections, these are not always accurate. In 2015 the final polls suggested that Conservatives and Labour were neck and neck and that the country was heading for a hung parliament. In practice, the Conservatives enjoyed a seven point lead. Meanwhile, in the election held this June the polls on average put the Conservatives eight points ahead, when, in the event, Theresa May’s lead over Labour proved to be just 2.5 points, insufficient for her to retain her overall majority.
Still, there might be thought to be one way in which we can safely predict the outcome of an election – if only a few hours before the results themselves become known. This is to poll voters as they leave the polling station and ask them how they have voted. Indeed, in many a country, this has now become one of the rituals of election night. As long as the exit poll forecast is correct, its publication allows politicians and commentators to consider and discuss straight away the possible implications of the result, and allows the editors of election programmes to decide who they want to persuade to come on air.
Indeed, you might think that conducting an exit poll was one of the least challenging bits of forecasting in which social scientists might engage. After all, if you have ascertained how voters have just voted, what more needs to be known? It is arguably more like reportage than forecasting.
However, this is far from the case, at least so far as exit polling in the UK is concerned. There are two particular challenges. First, we have to remember that any exit poll has to be conducted at a sample of polling stations. And in the UK, unlike many other countries, the results of an election are not counted and published separately, polling station by polling station. Consequently, it is impossible to use past election results to ascertain whether any sample of polling stations that has been selected is politically representative of the country as a whole.
Second, the UK uses a single member plurality (or first-past-the-post) electoral system. As a result, there is no straightforward, predictable link between nationwide votes won and parliamentary seats secured. Everything depends on the outcome in 650 entirely separate constituency contests.
Nevertheless, while the polls struggled to anticipate the outcome of the last two elections correctly, the exit poll that was analysed by ourselves on behalf of the three main broadcasters, the BBC, ITV and Sky, proved to be a relatively reliable guide. In 2015, the exit poll indicated there was little doubt that David Cameron would remain Prime Minister. In 2017, it suggested that Theresa May had lost her majority. Both predictions were so much at odds with what most people were expecting that they gave rise to considerable surprise. Yet in both cases surprise turned more or less into reality.
So how does the exit poll overcome the considerable challenges that face the conduct of any such exercise in the UK? The first, key step is a methodological choice about what it should estimate. Remarkable though it might seem the poll is not used to estimate directly how many people have voted Conservative, Labour or whatever. Rather, following an approach first proposed by Prof. David Firth of Warwick University, it is used to estimate how much support for the parties has gone up or gone down since the last election.
Why does this help? Well, the level of support for a political party varies very substantially from one locality to another. There is thus a real risk that, however carefully it might have been chosen, any sample of polling stations will contain too many Conservative voters, or too many Labour supporters, or whatever. In contrast, the extent to which a party’s vote goes up or goes down since the last election varies much less from one location to another. Consequently, there is much less risk that any sample of polling stations will prove unrepresentative of the changes in the popularity of the parties as opposed to their level of support.
Even so, this observation does rather seem to beg the question. We can only estimate the change in a party’s support at a particular polling station if we know how people voted there last time. And that, as we have observed, is a key piece of information that is not readily available – unless, that is, the voters there were exit polled at the last election!
Thus, wherever possible, the exit poll is conducted at exactly the same polling stations as the previous exit poll. True, this is not always possible. Perhaps last time voters in a neighbourhood voted in the local church hall, but this time are voting in the local primary school instead. That kind of change, though, rarely gives rise to any difficulty. What does matter is if the boundary of the area being served by a polling station undergoes radical change (at worst, perhaps, the polling district may be dismembered entirely) – or maybe a new housing estate has been built or a block of flats knocked down. Then it can be a matter of judgement as to whether or not to scrap the polling station and find a new one. If we do have to do that then typically we look for a station that on the available census data and past local election results looks as though it might be typical politically of the constituency in which it is located, thereby enabling us to use the last election result in that constituency as our baseline measure.
Still, thanks not least to the fact that the 2017 election was held just two years after its predecessor; few such complications arose this time around. Indeed, the exit poll was able to return to all of the 141 polling stations that had been covered by the 2015 poll. In addition, the decision was made to add three new sampling points in order to improve the poll’s coverage of safe Labour constituencies, although the sample remains one that is disproportionately concentrated in constituencies that are marginal between the Conservatives and Labour.
Focusing on the change in party support has a number of other advantages too. Typically, around one in five of those who are approached refuse to participate in the exit poll. These voters may, of course, vote differently from those who do participate. But if it is always more or less the same kind of people who refuse, then any resulting bias in the political preferences of those who do vote will be constant and should not affect our estimate of the change in party support. Meanwhile, around one in six people vote by post and thus are not captured by the exit poll at all. They too, might vote differently from those who make it to the polling station. But, again, if any difference is constant, it should not introduce error into the exit poll. In effect, we assume that the change in the popularity of the parties amongst those who vote by post is much the same as it is amongst those who do vote in person.
Equally, by the same logic, there is certainly no guarantee that any individual polling station is politically representative of the constituency in which it is located. But there is every good reason to anticipate that the change in party support at any polling station is indicative of the change in support across the constituency as a whole. It is this assumption that is central to how the key data that were generated by the 2017 poll – estimates of the changes in party support at 144 polling stations – were eventually analysed and modelled.
But how are the data from which those estimates of change are derived actually obtained? At each station, interviewers – supplied and managed jointly by GfK and Ipsos MORI – are instructed to approach one in n of those who leave the polling station, where n is inversely related to the number of voters registered to vote at that station. The aim is to approach approximately the same number of voters at each station irrespective of how many are registered to vote, and to ensure that interviewers can cope with the flow of voters as they leave the station. Participants are provided with a mock ballot paper that mimics almost exactly the one they have just completed, and are invited to place it in a mock ballot box, thereby ensuring that they do not have to reveal to the interviewer how they have just voted.
The data are periodically phoned in throughout the day – in the event the 2017 exercise interviewed over 30,000 voters – and thus the exit poll forecast emerges gradually as polling day unfolds. Given that it is illegal to publish any information about how people have voted in advance of the close of the polls, the exercise is conducted under tight security and only a very limited number of people have access to the forecast before Big Ben strikes 10pm.
Although changes in party support may not vary from one location to another as much as levels of party support, they do vary. Moreover, systematic differences in the pattern of movement between one kind of constituency and another can have important implications for the overall outcome in seats. If, for example, there were a swing nationally to the Conservatives, but this swing was less strong in the most marginal seats that Labour were defending, the Conservatives would win fewer and Labour more seats than would otherwise be the case. Thus, on the basis that the 144 polling station estimates of the changes in party support are indicative of what is happening in the constituencies of which they are part, our task as the analysis team is to identify and model the systematic and significant variations in party performance in the data, bringing to bear to the task a wide range of information about the social and political character of each constituency as well its geographical location.
The product of these analyses is a series of equations that between them specify the estimated change in support for each party and how the size of the change is expected to vary according to certain specific constituency characteristics. The equations are structured so that the sum of the changes across all parties in each constituency always sums to zero! They are then solved for each individual constituency, using the values of the independent (predictor) variables for that constituency. The resulting predicted changes for each party in each constituency are then applied to the actual result last time, and thus by this somewhat circuitous route we eventually secure a forecast share of the vote for each party in every constituency in Britain.
It might be anticipated that at this point at least our task is done. Under the electoral system each constituency seat is, of course, assigned to whichever candidate has won most votes. So, it might be thought that the forecast tally of seats for each party is simply the total number of seats in which a party is predicted to come first. Not quite. Even if our modelling of the parties’ performances is successful at identifying much of the systematic variation in change in party support, our estimates of the outcome in each seat will certainly be subject to random variation. So, if, say, we are predicting that the Conservatives will win 43% of the vote in a constituency, and Labour 42%, we are far from 100% certain that the Conservatives will win the seat. In truth, there is probably little more than a 50% chance that they will do so.
The final stage of the forecast process, therefore, is to convert the forecast shares for each party in each seat into probabilities that each party will win each seat. The forecast UK-wide outcome in seats that is released at 10pm as the polling stations close is, in fact, the sum of these probabilities. That, of course, means that there quite a lot of seats where we are far from sure who will win, but this does not stop us from providing a central forecast of the total number of seats each party will win.
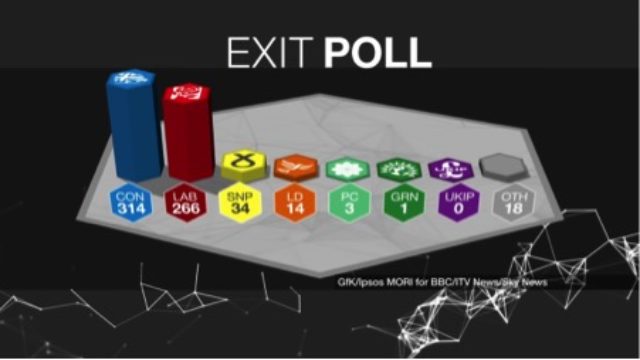
The potential importance of the modelling of the changes in party support that we undertake is amply illustrated by the results of the 2017 exit poll. In Table 1 we show the number of seats that at 10pm it was forecast that each party would win, together with the actual final tally. As can be seen the prediction was within four seats of the outcome for both the Conservatives and Labour and was no more than a seat or two adrift for any of the other parties. At just over 1.5, the average error per party was as low as it has been in any recent exit poll. Although our central estimate pointed to the Conservatives being short of an overall majority, the headline placed on the poll was ‘Conservatives largest party’ rather than ‘Hung Parliament’. This was because, given the sampling variation to which the exercise is subject, we could not rule out the possibility that the Conservatives might win the 326 seats required for an overall majority.
Table 1: Exit Poll Forecast and Actual Result of the 2017 Election Compared
| Party | ||||||||
| Seats |
Conservatives |
Labour |
Liberal
Democrats |
SNP |
Plaid
Cymru |
UKIP |
Greens |
Others |
| Exit poll forecast | 314 | 266 | 14 | 34 | 3 | 0 | 1 | 18 |
| Election result | 318 | 262 | 12 | 35 | 4 | 0 | 1 | 18 |
| Difference | -4 | +4 | +2 | -1 | -1 | 0 | 0 | 0 |
Behind the forecast was some extensive modelling of the variation in Conservative and Labour performance in particular. First, we identified that the Conservatives were performing relatively well (and Labour relatively badly) in seats that were currently held by Labour and where more than half of voters voted to Leave the European Union in the June 2016 referendum. Second, it also appeared that the Conservatives were enjoying relative success in constituencies where less than 25% are graduates, another feature associated with a relatively strong Leave vote in 2016. These patterns implied that the Conservatives might gain Labour-held seats that they might not otherwise win – as indeed proved to be the case. Meanwhile, and in addition to these patterns, we also estimated that the Conservatives would do relatively well in marginal seats that the party was defending against a Labour challenge, a trend that could help the Conservatives retain seats that they might otherwise lose. It was also clear that the Conservatives were performing relatively well in Scotland (as certainly proved to be the case) and in Wales (rather less so).
In short, our modelling identified a number of patterns that between them suggested that the Conservatives might do better in terms of seats – and Labour less well – than might be the case if the ups and downs in party support were to be the same in each and every constituency. Without any modelling at all we would have predicted that the Conservatives would win just 300 seats, as many as 18 wide of the mark. More seriously we would have implied that it would be nigh impossible for the Conservatives to form another administration. That would not have proven a good steer to the politicians and commentators.
Decisions about how to model the data are thus potentially crucial. Yet they often have to be made quickly. Although data are phoned in on a regular basis throughout the day, and although the earlier data can provide valuable clues as what models look best, most voters vote relatively late in the day, after leaving work. As a result, much of the data only arrives within an hour or two of the need to produce a published forecast and the information that arrives at this point can change the picture significantly. Quick decision-making of the kind not normally needed in academic life is essential!
Still, no matter how successful our modelling of the data might be, and no matter how appropriate the methodology might be, the exercise would not succeed at all but for the willingness of interviewers to stand outside a polling station for hours on end, sometimes in inclement weather, and persuade and cajole as many voters as possible to participate in the poll. But for their efforts, we would have nothing to say.
Equally, the exercise would not happen at all but for the resources invested in it by three commissioning broadcasting organisations. They have perhaps found themselves on more of a roller coaster at 10pm on recent election nights than they ever imagined possible. However, whatever worries they might have had in private, they have always faithfully broadcast the results with which we have presented them, no matter how surprising they seem. Hopefully, their audiences think the exercise has been worth it.
Note:
The 2017 exit poll was commissioned jointly by BBC, ITV and Sky. The interviewing was carried out by GfK and Ipsos-Mori. Roger Mortimore and Ipsos-Mori conducted the important and painstaking work of reviewing old and selecting new polling stations. Analysis of the data and production of the published prediction was undertaken with the help of Patrick English and Robert Ford.
John Curtice is Professor of Politics at the University of Strathclyde and Senior Research Fellow at NatCen Social Research. He is particularly interested in electoral behaviour and researching political and social attitudes. He is the current President of the British Polling Council and a member of the steering committee of the Comparative Study of Elections Project; chief commentator at whatukthinks. He has been involved in election broadcasting for almost 40 years. Stephen Fisher is Associate Professor in Political Sociology and Fellow of Trinity College Cambridge. His research focuses on political attitudes and behaviour, especially on elections and voting in Britain and elsewhere. He has developed a method for long-range election forecasting @StephenDFisher. Jouni Kuha is Associate Professor of Statistics and Research Methodology. His research interests include social statistics; research design; categorical data analysis; measurement; missing data; cross-national surveys; latent variable modelling. Jon Mellon is a research fellow at Nuffield College Oxford with the British Election Study. His Research Interests are in Election studies, longitudinal analysis, survey research, political sociology, Internet data, political participation, political methodology
Image by kind permission of the BBC