
Adam Leaver, University of Manchester [pdf]
The Governor of the Bank of England, Mark Carney, recently announced that we should be more optimistic about the UK economy because “the recovery has finally taken hold”. His remarks come at a time when there is lingering doubt about what this recovery is delivering to ordinary households and indeed whether it is sustainable at all. That is the essence of Labour’s ‘Cost Of Living Crisis’ agenda, which revives an interest in inequality, in particular the disparity of consumption experience between the top and bottom.
Reports suggest that Miliband may be cooling on the radicalism. That would be a mistake. If Labour wants to make political capital from this emerging social problem, it needs policy that is more, not less, ambitious. That is because the current crisis is rooted in structural changes in the distribution of GDP that are difficult to remedy through the normal fiscal and welfare levers.
The emphasis on cost of living inequalities opens up a new line of sight. It is possible to calculate the residual income left to different income deciles by adding together wages and salaries, direct cash benefits, self-employment income, pensions & annuities, investment income and other income and then subtracting income taxes, council taxes (after rebates) and employee NI contributions. This then adjusts the residual income left to households to reflect changes in welfare and tax policy. The data can be adjusted further by equivalising the figures to reflect household size and composition.
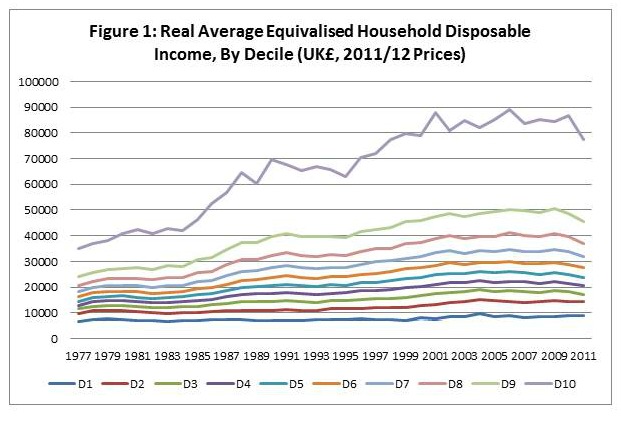
Using this method, two main points can be made. The first is that the Thatcher governments of the 1980s literally did make the rich (considerably) richer and the poor (marginally) poorer, though obviously such margins at the lower end of the income scale have greater standard of living implications. As figure 1 demonstrates, real average disposable income, adjusted for household size, for the top 10% of income earning households increased from £40,651 in 1980 to £69,603 by 1990 – a real increase of 71.2% against 36.3% for the average and a fall of 5.6% for the poorest 10%. Top to bottom inequality duly rose from 5.64 times in 1980 to 10.23 times by 1990.
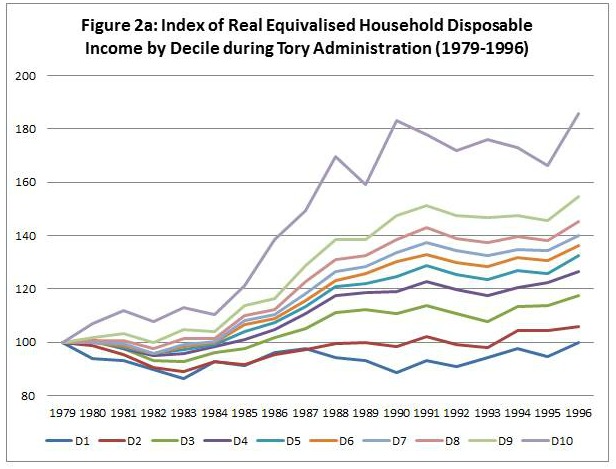
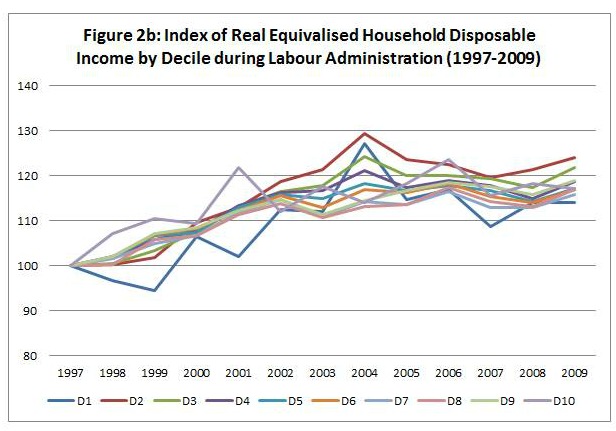
The second point is that the 1997-2009 Labour governments did not reverse this step like increase in disposable income inequality. Figures 2a and 2b break down and index disposable income growth by Tory and Labour administrations. Again, this illustrates the runaway growth of D10, particularly through the 1980s and the more general fanning out of income differentials across the deciles – the unfortunate fifth at the bottom end of the income scale received barely any real increase in disposable income over 17 years of Conservative rule. The figures for New Labour show that growth under New Labour was distributed more equitably across the deciles. But this effectively meant that Labour locked in the inequalities of the 80s and therefore missed their historic opportunity to reverse the Conservative’s policy outcomes.
But there are other ways to think about and periodise disposable income inequality. If we were to reframe these trends temporally by the decade rather than politically by administration, then we see a different picture – a picture which tells us something more troubling about the character of the growth model that underlies these administrations. What emerges is the slowdown in real disposable income growth across all deciles: in the 1980s average disposable income rises by 28.7%, although this is heavily skewed to the top 10-20%. By the 1990s the average rate of growth slows to just 13.8% across the decade in real terms; and for the 2000s that average falls to just 9%. The post-2009 figure is even more bleak, with average disposable income falling back to 2000 levels in real terms by 2011.
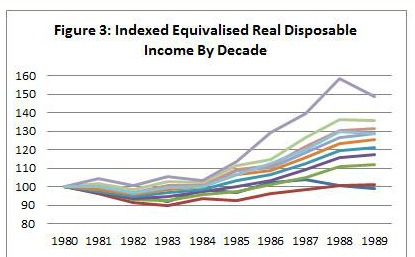
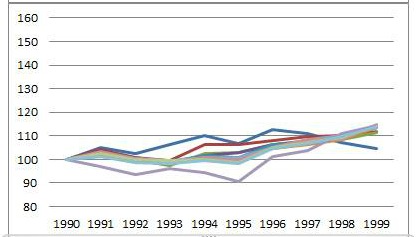
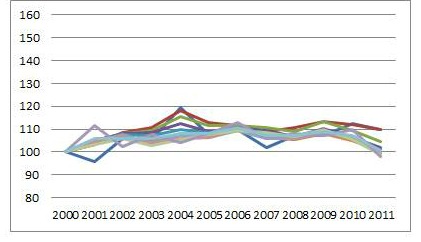
Within this overall average there are notable differences of experience for different deciles across the decades. We know that the 1980s disproportionately benefitted the rich and disadvantaged the poor as the trajectories of deciles fanned: D1’s saw their real disposable incomes fall by 1% whilst D10s saw theirs grow 48.6%. But the 1990s saw a flatter distribution: for D1, the poorest decile, disposable income rose 4.8% in real terms whilst for D10, the richest, it rose 14.5% – still substantially different, but not to the same degree as the 1980s. The 2000s however tell a different story with little difference between D1 and D10 disposable income growth, rising 7.1% and 7.2% respectively over the decade. The post 2009 story shows a reversal: for D1s, disposable income grew 9.8% on their 2000 average whilst D10s fall by 1.8%, with D9 and D8 also down on their 2000 average. Ironically the outcome of the Conservative administration since 2009 has been an attack on the disposable income of their traditional constituency of the top 30% of income earners, at least if the ONS figures are accurate and the trend continues to 2013.
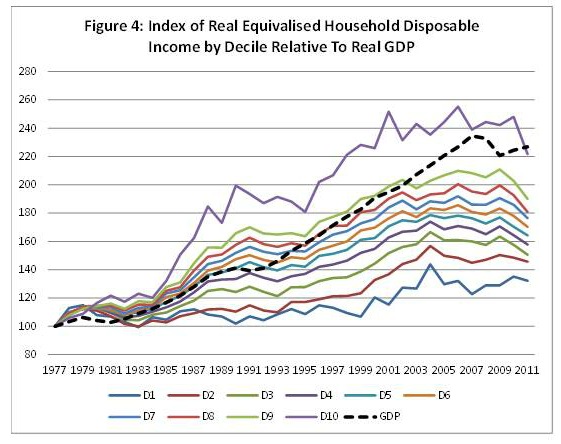
The above data show a trajectory of disposable income growth by decile which polarised during the 1980s, where those disparities were locked in during the 1990s and 2000s. But it also shows one of slowdown in disposable income growth more generally across all deciles in real terms. That is starkly revealed by indexing these trends against real GDP (Figure 4). Average disposable income was a kind of lien on productive output throughout the 1980s, but this trend changed sharply in the 1990s as average disposable incomes decline relative to GDP and upper middle income group’s disposable income (D6 to D9) fail to keep up with GDP growth. Only D10s maintain a growth rate similar to GDP during this period. By the end of the 2000s even D10s struggle to achieve growth rates close to GDP.
So how might we interpret this data?
The first point, if we are to take the ONS figures at face value, is that the UK’s problem is not necessarily the growing disparity of consumption opportunities between D1 and D10. But rather the relative shares of GDP taken by components other than worker compensation. Workers compensation as a percentage of GDP is 2 to 3 percentage points below the post-War long run average and 5 to 6 percentage points below where it was in 1980. This is almost inversely proportional to the growing share of GDP taken by the operating surpluses of financial corporations. The key problem, then, is the falling share of GDP taken by labour and the growing share taken by (financial) capital. That discourse – with all of its Marxian connotations – may be much more difficult for Labour to mobilise, even though it is a more salient moral and economic problem.
Second, the emphasis on deciles may disguise more extreme polarisation, as the top 1% pull away from the bottom 99%. And it is estimated that 50% of the top 1% of income earners work in financial services.
Third, it may tell us something about the in-built limits of the UKs growth model initiated under the Thatcher government. Workers can no longer expect to take a lien on GDP growth as they once did in the 1980s (even though it was distributed inequitably through the deciles). The liberalisation of the 1980s did seem to create a fleeting moment of opportunity for the fortunate 30-40% of skilled workers who claimed disposable income increases above the rate of GDP growth. But that liberalisation also left the UK open to large domestic and global companies who congealed around the apparatus of the state, and monopolised the capture of household spend on essentials after privatisation. The fluidity of the 1980s gave way to retrenchment and reversal in the 1990s. Through privatisation and liberalisation the UK economy had become pervious to large corporate interests with no countervailing force to prevent them from ‘doing what was easy’. The privatisation of essential goods and services created a large guaranteed income stream, while labour market reform meant controlling wages was much easier, even for skilled workers. The 1990s and 2000s saw the sedation of entrepreneurial instincts as government and households effectively underwrote the profits of uninspiring, risk-averse companies. Capital satisfices. It moves to the point of least resistance, where the combination of low but secure margins plus scale will trump any high return, innovative, risky venture.
Fourth, it is understandable how credit (and capital gains) as a source of additional consumption power becomes important in a low disposable income growth world. The potential tension is that we are now reliant on debt for our consumption practices without necessarily the disposable incomes to service it. This may signal the limits of the model, and creates all kinds of problems going forward as government becomes locked into a low interest rate environment to maintain momentum and prevent deep stall in an over-levered world.
This all begs the more difficult question of why GDP growth is important to households at all, if they no longer hold a stake in it? This should be the most pressing question asked by social democratic and progressive politicians. Getting them to ask it, however, will require the political courage to combat the vested interests of finance and the vulture companies in sheltered sectors who are all, in some way or other, levered on the State and the national workforce.
Adam Leaver is Senior Lecturer in Financialization and Business Analysis at Manchester Business School and an active researcher at the Centre for Research on Socio-Cultural Change (CRESC). He also runs, and is the main contributing writer to, the Manchester Capitalism blogsite: manchestercapitalism.blogspot.co.uk/.