
Katharina Hecht (LSE)
The top 1 percent of income earners in the UK accounted for as much as 15 percent of total income in 2010. This share has increased to differing degrees in all Anglo-Saxon countries since the 1970s; in the UK it more than doubled over this period (Piketty, 2014). Wealth inequality is even more concentrated than income inequality, hence the share of the top 1 percent in total wealth is even higher; 28 percent in 2010 up from 23 percent in 1970. See here and here for Piketty’s figures on the evolution of these measures of economic inequality.
The empirical finding by economists that increases in top incomes and wealth rather than poverty are driving inequality has led to a recent revival of elite studies in the discipline of sociology (Khan, 2012). What do these research findings regarding rising inequality mean for sociological research? And how can we make sense of these developments, which Savage (2014) sees as one of the defining features of our time?
Firstly, examining economic inequality focussing on top income and wealth opens up possibilities for conceptualising a more relational approach to social stratification. The key here is that the top 1 percent is more internally differentiated than any other income (or wealth) group. Secondly, researching the social characteristics of individuals situated at the top of the income and wealth distributions sheds light on contemporary inequalities, in particular those of gender. In addition, it allows social scientists to assess gradients at the very top regarding variables of interest including socio-economic background, age, gender as well as social and cultural capital. My ideas are based on early findings from a mixed-methods doctoral study at the LSE which seeks to research how high income earners understand economic inequality.
Economic inequality within the top 1 percent is remarkable, and I argue that reflecting on the social dimensions of inequality within this income or wealth bracket allows more relational conceptualisations of social stratification. To illustrate this with an example of income; in 2010, the average income in the UK (gross before tax) amongst the top 10, the top 1, the top 0.5 and the top 0.1 percent of income earners was £76k, £251k, 369£k and £931k, respectively. The implication of this steep curve (Figure 1) is that the incomes of the top 1 percent are more dispersed, and increasingly so, compared to the rest of society.
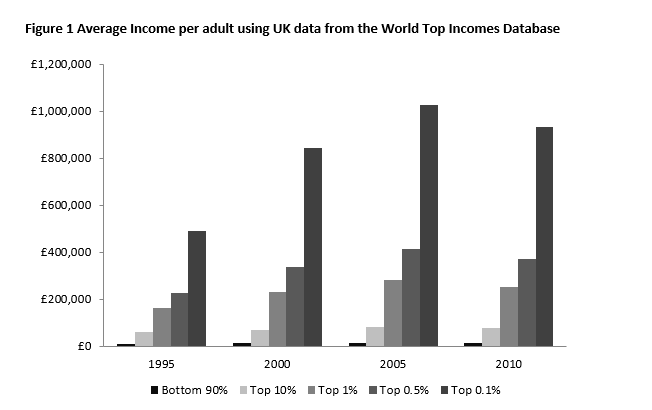 Data source: Alvaredo, Facundo, Anthony B. Atkinson, Thomas Piketty and Emmanuel Saez, The World Top Incomes Database.
Sociologists need to explore how these findings relate to social comparisons. For instance, these developments may increase ‘relative deprivation’ as the variation in income for individuals’ ‘comparative reference groups’ (Runciman, 1966; see also Rose, 2006) increases. Thus, those in the top 1 percent, but not the top 0.1 percent or the top 0.5 percent (for instance) might feel that they have lost out in relative terms. As a result of this comparison, individuals may strive for even higher incomes. This could constitute an important sociological driver of inequality. Hence, there is a paradox that high income earners may feel a sense of ‘relative deprivation’ or disadvantage if they compare themselves with those higher up the income distribution, even though they have themselves done very well in absolute terms. Therefore, rather than conceptualising high income earners or those with significant financial assets as a new class and focussing on where legitimate cut-off points are (the 1% or the .01%?), paying attention to the relational aspects arising out of the increasingly high variation at the top end of the income distribution allows sociologists to explore potential social explanations for increased inequality in top incomes and attitudes to that inequality among top income earners.
Apart from basic demographic traits, not much is known about ‘the one percent’. Keister, (2014) summarises that, in the US, members of the top 1 percent are ‘disproportionately male, white, and married’ and they ‘tend to be middle-aged, to have at least a college education, and to be employed in professional and managerial occupations’. Gender inequality within this group is particularly striking. Only 2.2 percent of the top 1 percent of income earners and 4.2 percent of the top 1 percent of wealth holders are female. Analysis of the BBC Great British Class Survey (GBCS) (see Savage et al., 2013), a non-representative, but unusually large dataset (n=233,175) with a high proportion of individuals with high household income (£100k after taxes), finds that the demographic characteristics of GBCS respondents from top income households are fairly similar to those found by Keister in the US. According to national statistics from HM Revenue & Customs estimated from the Survey of Personal Incomes, the 99th percentile point on the income distribution or the threshold to the top 1 percent for an individual was £100k after tax in the tax year 2011-12. Similarly, Danny Dorling (2014) estimates with reference to a report by the Institute for Fiscal Studies, that to qualify to be a member of the top 1 percent in the UK, an income of approximately £115k a year from all income sources after income taxes is needed in 2011–12 (or £147k before tax). Dorling (2014) notes that ‘this estimate is for a childless couple. Should you be single, you can enter the 1 per cent with a little less; should you have children, you’ll need a somewhat higher household income’. On the ResearchingSociology@LSE blog you can find a post of Dorling’s lecture at LSE.
GBCS respondents from high-income households are on average older than all other income groups, more likely to have been educated to degree-level and more likely to be married or living with their partner (Table 1). Refer to Table 1 for the three highest income brackets available in the GBCS dataset; those respondents were defined as individuals with high household income for the purposes of this blog post. Individuals with high household income are also almost twice as likely to work in a traditional professional occupation, and about three times as likely to be working in a senior managerial position as are all other respondents (1). For GBCS respondents, who indicated their savings exceed £200k, or that the value of their property exceeds £500k, the pattern is somewhat similar. There is also gender inequality; only 33 percent of individuals with the highest household income (>£200k) are female.
As one would expect, respondents with high household incomes are disproportionately more likely to have high savings or own high-value properties. Out of those respondents from households with income of at least £200k, 76 percent also own a property worth more than £500k, and 69 percent have savings larger than £200k. In comparison, those on the lower end of the high income spectrum (household income between £100-149k) are approximately half as likely to do so; 38 percent own property worth more than £500k and 27 percent have savings higher than £200k. As outlined by Savage elsewhere in this issue of Discover Society, research from the GBCS demonstrates that those from high income households or with high savings or property value are more likely to be from advantaged backgrounds. Approximately two thirds of respondents in the highest income bracket (with household income exceeding £200k) are from families with either traditional professional or senior managerial background, compared to individuals with income less than £100k where about two thirds are from neither of these professional backgrounds.
Table 1 Socio-demographic characteristics of GBCS respondents with high household income, the highest value property or high savings
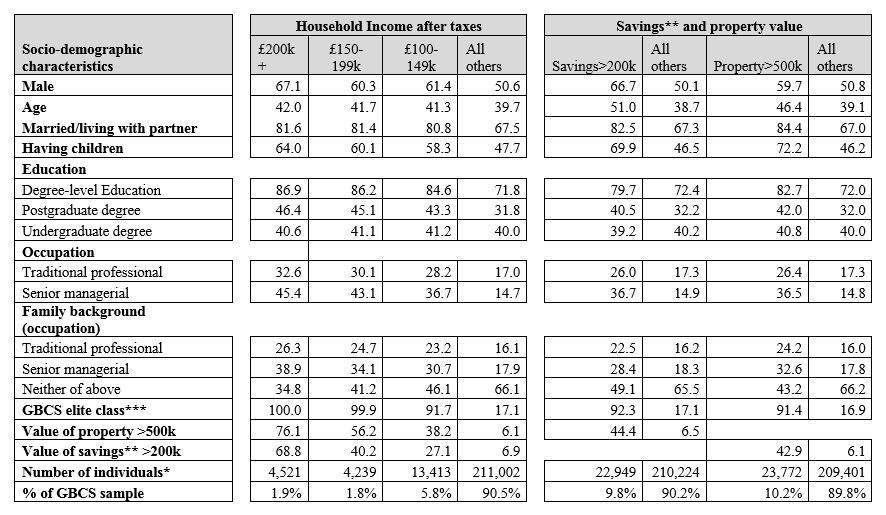
Notes: All figures are percentages except age and number of individuals
* The difference between the sample sizes is due to missing values
** Aside from value of house
*** All others are assigned to either the latent class established middle class, or technical middle class
Data source: GBCS, wave 1 and 2. The sample size excludes respondents which are non-UK residents, individuals younger than 22, and those still in education. The data is derived from a non-probability sample and is skewed. For a discussion of this issue see Savage et al. (2013) and Savage et al. (2014). See also Mills (2014).
Finally, exploring attitudes of high income earners, while keeping in mind the skewed top end of the income distribution, may shed light on interesting gradients beyond traditional concerns of social class differences (Table 2). For instance, a majority of GBCS respondents (54%) with the highest household income indicate they feel that they belong to the upper middle class compared to a minority (8%) who do so those from the general population. Strikingly, a significant minority (5.9%) of individuals with the highest household income indicates they belong to the upper class compared to a minority (0.9%) who do so from households with income between £100k-149k and a miniscule minority (0.2%) of those from households with income less than £100k.
In regards to a respondent’s social network, there is also an economic gradient; the most striking being that 38 percent of respondents from households with incomes larger than £200k indicate they know an aristocrat socially, compared to 20 percent of those with income £100-149k, and 10 percent of those with income less than £100k. On the other hand, 7 percent of respondents with the highest household income indicate they know a postal worker socially, compared to 10 percent of those with income £100-149k, and 21 percent of those with income less than £100k. Similarly, and not surprisingly, there is an economic gradient in the GBCS data for all measures of cultural capital which require economic capital. This includes not only those activities which are traditionally viewed as being ‘high-brow’ cultural activities in the Bourdieusian sense, but interestingly also what Savage et al. (2014) term ‘emerging’ cultural capital including going to the gym, playing sport or watching sport live (Table 2).
Table 2 Descriptive portrait of GBCS respondents with high household income, the highest value property or high savings
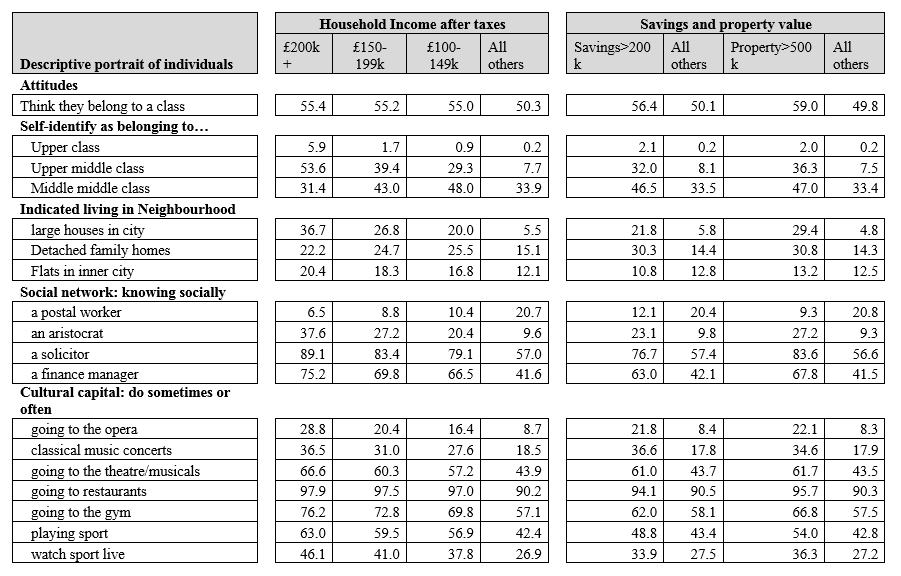
Note: All figures are percentages
Data source: As for Table 1
I have shown that recent increases in economic inequality of top incomes and wealth should be a key concern not only for sociologists but for those more widely seeking to understand inequality. The vast and increasing internal differentiation within top income earners visualised with data from the World Top Incomes Database challenges sociologists to reflect on how this impacts social comparisons; and on how increased income variation within comparative reference groups might constitute a sociological driver of inequality. Social inequities such as gender inequality within the 1 percent and economic gradients even between high income groups, as observed in the unique GBCS dataset, further illustrate why the increase in inequality at the top end of the income and wealth distributions is of interest for sociologists.
Note:
GBCS respondents were asked to “Please tick one box to show which best describes the sort of work the main income earner did.” Response options included “Traditional professional occupations such as: accountant – solicitor – medical practitioner – scientist – civil / mechanical engineer” and “Senior managers and administrators (usually responsible for planning, organising and co-ordinating work and for finance) such as: finance manager – chief executive – military (officer)”.
Katharina Hecht is a PhD student in Sociology at LSE, researching economic inequality and how it is understood by individuals situated at the top end of the income distribution. Katharina is interested in research methods and social science research on inequalities. She is also a class teacher on introductory quantitative methods courses for undergraduate and graduate students at LSE.