Dimitris Ballas (University of Sheffield), Danny Dorling (University of Oxford), Benjamin Hennig (University of Oxford)
“… we must re-create the European family in a regional structure, called, it may be, the United States of Europe…” (Winston Churchill, Zurich 19 September 1946)
The above and other similar statements by Winston Churchill (as well as the fact that he is widely considered to be one of the founding fathers of the European Union) may come as a surprise to many people, especially given the recent results of the European parliament elections that were described as a ‘Eurosceptic earthquake’. However, ever since the end of WW2, there has beengreat progress towards integration and the formation of a European identity by the people of a continent shattered by war towards a common purpose and future.
According to the most recent Eurobarometer survey taken in Spring 2014, “close to two-thirds of Europeans feel that they are citizens of the EU (65% replied ‘yes’). The proportion who considered themselves citizens had risen by 6 percentages points in the six months from autumn 2013”. The respective percentage for Britain, which is often considered to be one of the most ‘Europhobic countries’, is lower than the European average but still relatively high. More than half (52%) of the British people feel citizens of the EU. This is despite the predominantly and consistently Eurosceptic discourse in the British media.
It is also worth noting that there is a small but rapidly growing number of formal and informal organisations of Europeans, including some very active UK-based groups (such as the New Europeans, the European Movement and One Europe) who are promoting the idea of a collective European identity and the value and benefits of EU citizenshipand putting forward the argument that “Britain’s place is at the heart of the EU, working for an effective and efficient Union, prosperous at home and confident at the international level, able to defend the collective interest of its member states and deliver benefits for all their citizens”.
One way in which the debate on Europe might progress is to see Europe in a new light, not simply by reporting the results of opinion polls and the advocacy of think tanks, but by redrawing the map of Europe. A new cartography can further develop ideas of Europe as a single mass of people and help our thinking to move further towards a “Europe of people” instead of “nation-states”. Through such action we may see a bolstering of European identity to help us think of Europe and its economy, culture, history and both human and physical geography in terms of a single large land and population mass.
It could be argued that this is already happening to some extent, especially in the minds of the rapidly increasing numbers of Europeans who live, study and work in a member state other than their country of birth. Europe is also often increasingly presented in such terms by popular travel publications: “Few places pack the punch of Europe. From its Northern Lights to its Southern shores, this drama queen keeps on thrilling, surprising and confusing with her extraordinary wealth of sights, sounds, peoples and parties”. The notion of Europe in these terms can be further highlighted by looking at its physical and population geography simultaneously in new ways, using GIS and new human cartography techniques. That is what we are attempting to achieve in the work we describe here.
A country called Europe?
As three European geographers whose first languages are Greek, English and German respectively, we feel that the best way for us to contribute to the debates about what it means to be European is to consider and visualise Europe and its economy, culture, history and human and physical geography in terms of the single large land mass, but the land mass drawn anew. To that end we created The Social Atlas of Europe which is underpinned by the view that Europe is something much more than just a world region and a collection of nation states and by the idea that we are hopefully moving more towards the belief that many of us are a “European people” instead of a “Europe of nations”. It is possible to think further than that, to see yourself as a global citizen, but that is a very big step made easier by taking small steps towards it. We argue that the EU needs to be thought of an entity that is more than just a union of member states, more than just a common market or just a potential monetary or fiscal union. There is a need to rethink European identity.
What does it mean to be European today? To what extent do the citizens of EU member states feel that they are citizens of something larger than their own country? The Social Atlas highlights the notion of Europe as a single entity by looking at its physical and population geography simultaneously in new ways, using state of the art Geographical Information Systems (GIS) and new human cartography techniques, building on recent award-winning research and innovative Worldmapping applications. The new European atlas includes all states that have demonstrated a strong commitment to a common European future by being closely associated with the EU, either as current members or as official candidate states (or official potential candidates for EU accession) and/or states which are signed up to any of the following agreements: European Economic Area, the Schengen Zone, the European Monetary Union.
The map below shows these European countries using a rainbow colour scale to determine the colour hue for each state according to the year of association with the European Union. It also redraws the spatial extent of each geographical area on the basis of fine-level spatial information about where people live rather land mass. The technique that was developed and applied to create this map builds on the pioneering approach proposed by two physicists in 2004 which has which has been widely implemented and increasingly it is seen as the most appropriate way to visualise geographical data in the social sciences, if your interest is in seeing people rather than land, especially if you do not wish to concentrate on empty land. This type of map, known as a Hennig gridded-population cartogram approach, shows clearly where most people are concentrated. For example, Madrid, Paris, Istanbul and London are huge, while Scandinavia is small, whereas the Rhine-Ruhr metropolitan region in Western Europe, including the areas of Cologne, Dortmund and expanding towards the Netherlands, is much more prominent compared to a conventional map. In addition countries and regions that are more densely populated are more visible in the map (e.g. most of the United Kingdom, Italy, Poland, Romania) compared to rural large areas in the north of the Europe.
 Caption: Gridded-population cartogram of Europe; basemap: Hennig Projection Gridded Population Cartogram; source: The Social Atlas of Europe
The next map we present uses exactly the same projection as that above but is the topographic version of the previous cartogram, with the area being drawn proportionally to population but coloured by altitude. In this way physical and human geographies can be mixed up on the map. Rather like a traditional physical geography map, upon which cities are drawn, this is a new human geography map, upon which mountains and valleys are depicted.
 Caption: Gridded-population cartogram representation of the topography of Europe; basemap: Hennig Projection Gridded Population Cartogram; source: The Social Atlas of Europe
The mapping approach illustrated here, and the very different shapes it reveals offers a new way of thinking about Europe as a continent of regions and cities rather than nation-states and to realise the huge number of ways in which people living in different parts of Europe have so much in common. Overall, this innovative approach, transforming the human and physical space of Europe simultaneously used to create these maps, makes it more likely for Europeans to make more sense of both their home area’s physical and human geography and to think of Europe as one place – the place they belong to or their “homeland” (instead of just thinking so much of their nation-state), in other words, a country called Europe.
A geographical contribution to discovering European society and understanding European identity
The new Social Atlas of Europe we have been working on contains nearly two hundred maps and illustrations painting a picture of Europe, its people and its environment in relation to a wide range of themes and using data from a variety of sources such as the European Values Survey,Eurostat (also including data from surveys such as the European Union Survey of Living Conditions), the International Labour Organisation, the World Bank and the World Health Organisation.
All maps are accompanied by a commentary and in some cases by graphs showing additional complementary information. A couple of examples are shown below (more sample material and discussion of the different types of maps can be accessed via the Social Atlas web-site). The importance of the first is well illustrated by a humorous question that was asked of UKIP leader Nigel Farage on Bulgarian TV recently: “Is it not the case that without immigrants, the women in your country would grow moustaches, because you would have ended up marrying your first cousins?”  Caption: population born outside the country of residence, increase 2000-2010; source: The Social Atlas of Europe.
The map above stretches Europe in another way. It only shows a few of the people of Europe. It is a country cartogram created using national level data from the World Bank on international migrants, made by applying the same technique briefly discussed above. The map shows the absolute increases in number of residents that were ‘born abroad over the 2000s. The largest absolute increase is observed in Spain, followed by Italy, the United Kingdom and Germany. Spain also experienced the greatest increase over that period, as the number of residents born outside the country rose from 1,752,869 in 2000 to 6,377,524 in 2010, which represents an increase of 263% (but only as a share of the original immigrant population, not of the population as a whole). The second largest rate of change, measured as a share of the original immigrant population, was recorded in Iceland (134%) followed by Ireland (133%) and Italy (110%).
Since the year 2010 it is very likely that in at least two if not all three of these countries, all hit badly by the financial crisis, the share of overseas born has fallen.
Regional economic geography
When regional level data were available we were able to enrich the Hennig Projection Gridded Population Cartograms with more information, such as by shading the gridded-population cartograms according to a particular theme of interest. An example is shown in the map below, where we have coloured the resized grid cells on the basis of publicly available data from Eurostat for European statistical regions on Gross Domestic Product per inhabitant in purchasing power standard (PPS).
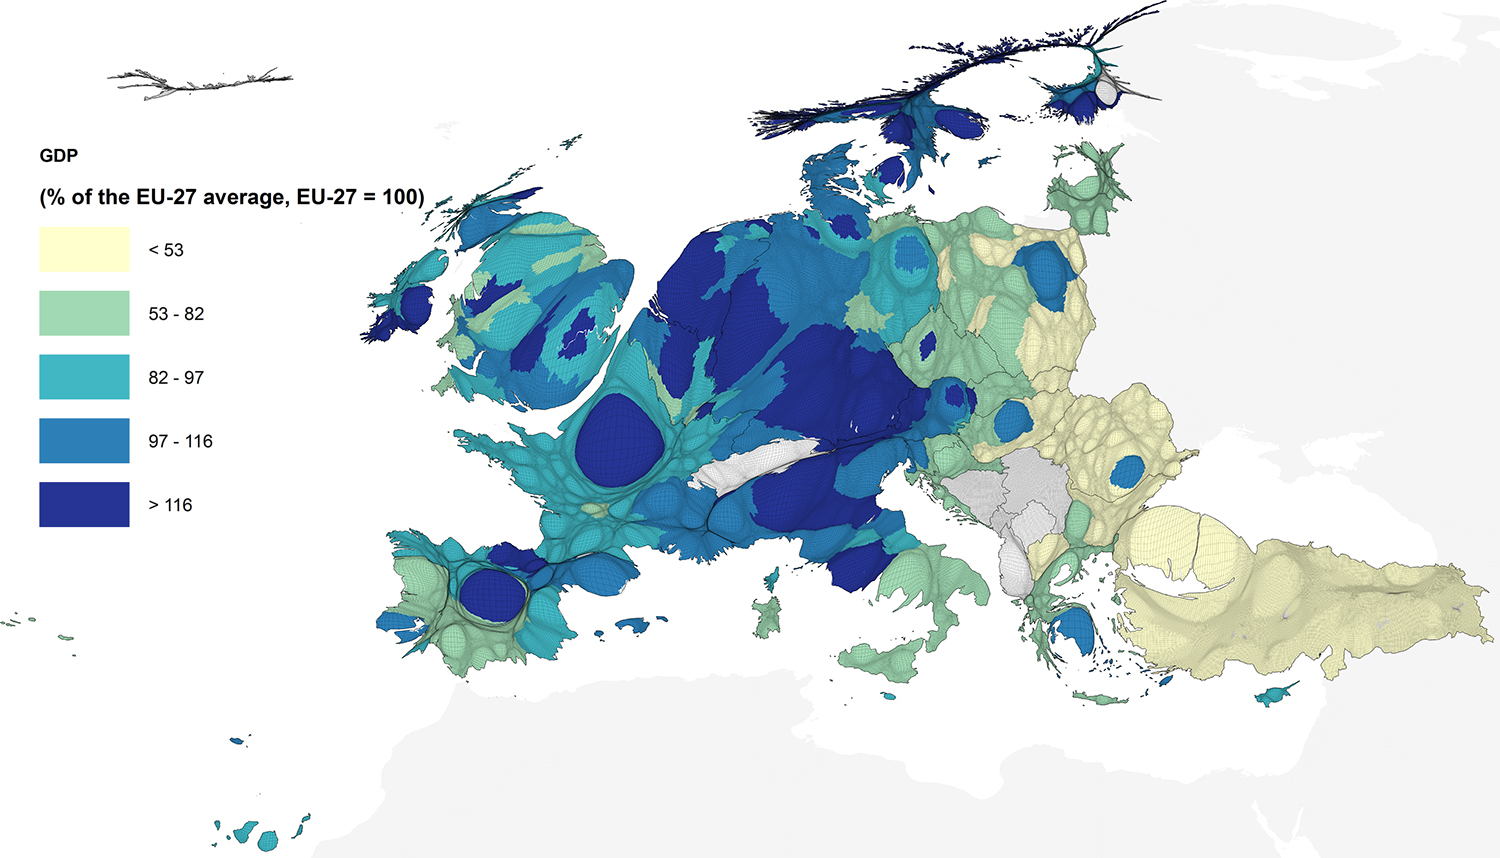 Caption: Gross domestic product (GDP) per inhabitant, in PPS by NUTS 2 regions (% of the EU-27 average, EU-27 = 100), 2010 (Turkey, national level) based on data from the Eurostat Regional Yearbook 2013; basemap: Hennig Projection Gridded Population Cartogram; source: The Social Atlas of Europe.
Looking at the patterns, it is noteworthy that there are two regions in the UK, Inner London and Berkshire, Buckinghamshire and Oxfordshire which belong to the top class of geographical areas with a GDP per inhabitant in PPS in Europe (over 125% of the EU average). These two regions have (in some ways) much more in common with other very affluent regions across Europe such as Luxembourg (266% of the EU average), the Belgian capital city region of Brussels (223%), the German city region of Hamburg (203%) and the Norwegian capital city region of Oslo og Akershus (192%) rather than with the rest of the UK. In contrast, regions such as Tess Valley and Durham (77%) and Northumberland and Tyne and Wear (88%) are more similar when considered by this measure to other European regions such as the island of Crete (80%) and the Ionian islands in Greece (76%), Leipzig in Germany (91%) and Galicia in Spain (90%).
Conclusions
The Social Atlas of Europe represents an attempt to tell a cartographic story of contemporary Europe by adopting a new visual approach to exploring European human geography and identity. The overall aim of the atlas is to show Europe as a whole, concentrating first on where most Europeans are, and then on how they most differ from each other. The atlas highlights the fact that very often the real differences in the quality of life and the types of challenges and problems faced by Europe’s populations are not found across national borders but between regions, villages and cities or between rich and poor quarters of a town. And the rich quarters of Europe are all more similar to each other (in many ways) than they are similar to the poorer areas that are nearer to them.
The following map shows all the large cities of Europe. Each is drawn to the size of the its population, but the strength of the colour shows how much light is emitted from each city and from across the countryside of the continent. The most wasteful cities in terms of energy use are to the north and west. On this map areas outside of the current European boundaries are also shown, to give an idea of the continent’s immediate context. The Nile delta is clear to see that outside of Europe, people are far less wasteful of energy- often they have less to waste.
. 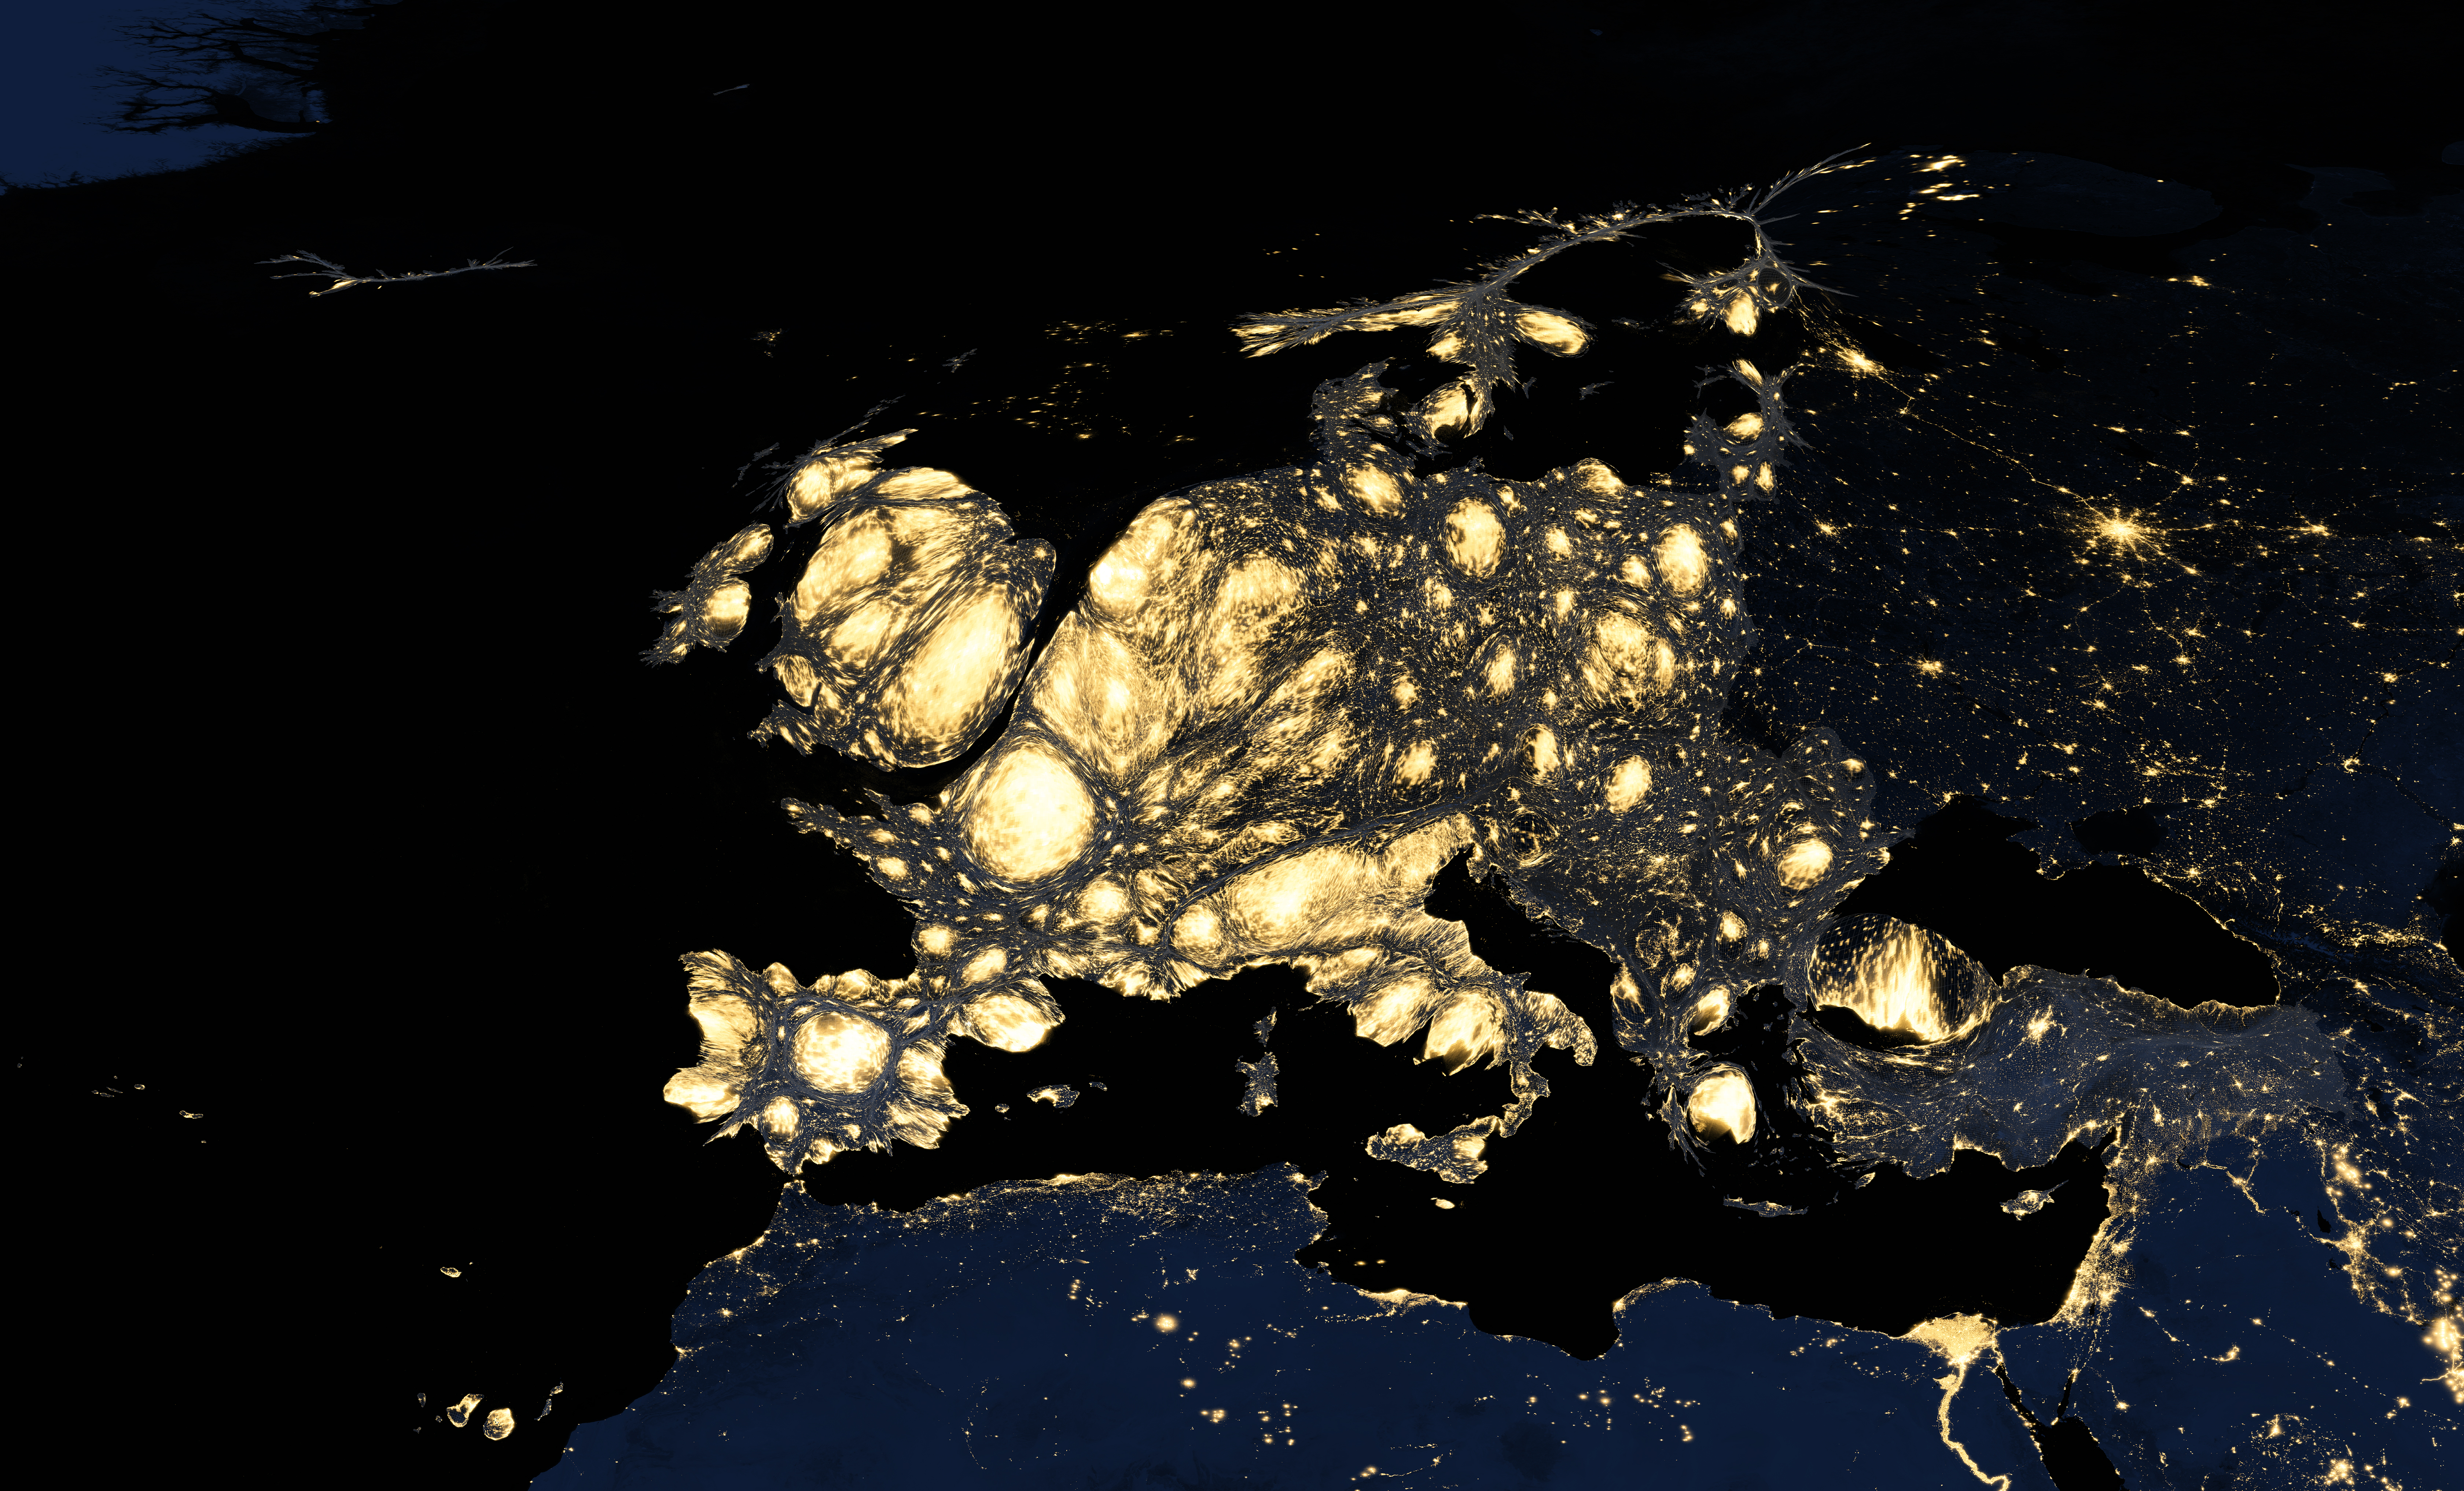
Caption: Europe at night; source:The Social Atlas of Europe.
There are thousands of people, mostly from Africa and Asia, risking their lives each year to reach this very affluent continent. According to The Migrants files a project set up by a pan-European consortium of journalists joining forces to calculate accurately and report the deaths of emigrants seeking refuge in Europe, there have been at least 25,000 migrants (including 46 babies and 388 children) who have died trying to enter Europe since 2000. This work (which includes maps of these tragic deaths) highlights the responsibilities of Europe to live up to its underpinning ideals, which include respect of human rights (including the far too little celebrated abolition of the death penalty) and the protection of minorities, all described in the so called Copenhagen criteria that need to be met before accession of a country to the EU is considered.
Overall, we hope that the collection of demographic, social, economic and environmental maps and diagrams presented in the atlas can be used to inform debates about European identity, by showing how Europe and its people can be seen as one entity, moving towards becoming a European people, united in diversity. In addition, we hope that the work presented in the atlas will help enhance feelings of social cohesion and solidarity amongst the people of Europe. We have tried to achieve this by highlighting important disparities and inequalities and, at the same time, reminding Europeans how much we have in common, and the potential for what can be achieved if we move away from a ‘nation state mentality’, thinking instead about Europe as a continent of cities rather than states, a continent of people rather than power and one of hope rather than decline, and highlighting that there is now, more than ever, a need to carry on working together rather than pulling apart.
Dimitris Ballas is a Senior Lecturer in the Department of Geography at the University of Sheffield. He has published widely in the field of Geoinformatics in the Social Sciences. Danny Dorling is a Professor of Human Geography at the University of Oxford. His recent books include Inequality and the 1%, All That Is Solid and ‘The 32 Stops: Lives on London’s Central Line. Benjamin D. Hennig is a geographer who loves maps. He is a Senior Research Fellow at the University of Oxford and maintains the website: www.viewsoftheworld.net